Quick Start Demo (ionerdss v.1.1.0)
[1]:
import sys
import os

# Go two levels up from docs/source/ to reach the project root
sys.path.insert(0, os.path.abspath('../../'))

import ionerdss as ion
import subprocess
from IPython.display import display, Image
[2]:
pdb_id = '8y7s'
save_folder = '~/Documents/8y7s_dir'

pdb_model = ion.PDBModel(pdb_id=pdb_id, save_dir=save_folder)

# set standard_output=True to see the determined interfaces
pdb_model.coarse_grain(distance_cutoff=0.35,
                       residue_cutoff=3,
                       show_coarse_grained_structure=False,
                       save_pymol_script=False,
                       standard_output=True)
Successfully downloaded assembly file: /Users/yueying/Documents/8y7s_dir/8y7s-assembly1.cif.gz
Binding interfaces detected:
Chain A:
  Center of Mass (COM): (-34.339210510253906, 24.67936134338379, 53.31415557861328)
  Interfaces: ['B', 'E', 'F']
  Interface Coordinates:
    (-41.347171783447266, 10.364765167236328, 67.06111145019531)
    Interface Energy: -81.39
    (-23.852462768554688, 22.23109245300293, 42.94672775268555)
    Interface Energy: -158.34
    (-29.409713745117188, -3.090428590774536, 42.99185562133789)
    Interface Energy: -24.95
Chain B:
  Center of Mass (COM): (-30.53473663330078, -12.089882850646973, 71.74038696289062)
  Interfaces: ['A', 'E', 'F']
  Interface Coordinates:
    (-43.43027877807617, 4.43478536605835, 66.61664581298828)
    Interface Energy: -81.39
    (-9.94083309173584, 10.356165885925293, 67.6988296508789)
    Interface Energy: -20.76
    (-16.25308609008789, -15.30644702911377, 68.10027313232422)
    Interface Energy: -177.66
Chain E:
  Center of Mass (COM): (-6.33309268951416, 14.933263778686523, 30.68675994873047)
  Interfaces: ['A', 'B', 'F']
  Interface Coordinates:
    (-17.488887786865234, 21.960044860839844, 38.76604080200195)
    Interface Energy: -158.34
    (-5.424167156219482, 14.917166709899902, 60.185665130615234)
    Interface Energy: -20.76
    (6.9928131103515625, 1.0576878786087036, 37.52962112426758)
    Interface Energy: -82.99
Chain F:
  Center of Mass (COM): (4.565953254699707, -13.369412422180176, 59.1125602722168)
  Interfaces: ['A', 'B', 'E']
  Interface Coordinates:
    (-24.323625564575195, -10.179375648498535, 45.17625045776367)
    Interface Energy: -24.95
    (-9.588534355163574, -15.176178932189941, 65.54202270507812)
    Interface Energy: -177.66
    (9.926722526550293, -0.46388891339302063, 41.9386100769043)
    Interface Energy: -82.99
[3]:
pdb_model.regularize_repeated_chains(dist_threshold_intra=3.5,
                                       dist_threshold_inter=3.5,
                                       angle_threshold=25.0,
                                       show_coarse_grained_structure=False,
                                       save_pymol_script=False,
                                       standard_output=False)
Repeated chains identified using sequence alignment:
{'F': 'A', 'A': 'A', 'E': 'A', 'B': 'A'}
Repeated chain groups identified:
[['A', 'B', 'E', 'F']]
Model saved successfully to /Users/yueying/Documents/8y7s_dir/8y7s_model.json
[4]:
from ionerdss import ParseComplexes

complex_list, complex_reaction_system = ParseComplexes(pdb_model)
print(f"Complex species: {len(complex_list)}")
for complex in complex_list:
    print(complex)
ComplexReactionSystem with 25 complexes and 114 reactions
C2 -> C1 + C1, 2.6833402014212607e-29
C1 + C1 -> C2, 5.969027996063232
C3 -> C1 + C1, 1.025794729272811e-62
C1 + C1 -> C3, 5.987544059753418
C4 -> C1 + C1, 8.758302924991361e-05
C1 + C1 -> C4, 5.998839855194092
C5 -> C1 + C2, 1.0238367610018499e-62
C1 + C2 -> C5, 5.9761152267456055
C5 -> C1 + C3, 2.675511324892301e-29
C1 + C3 -> C5, 5.95161247253418
C6 -> C1 + C4, 1.0238421724719456e-62
C1 + C4 -> C6, 5.976146697998047
C6 -> C1 + C3, 8.747112550132135e-05
C1 + C3 -> C6, 5.991175174713135
C7 -> C1 + C4, 2.6754958344361694e-29
C1 + C4 -> C7, 5.951578140258789
C7 -> C1 + C2, 8.747059725794045e-05
C1 + C2 -> C7, 5.991138935089111
C8 -> C7, 1.0316977576338455e-62
C7 -> C8, 6021999.999999999
C8 -> C6, 2.707153421458248e-29
C6 -> C8, 6021999.999999999
C8 -> C5, 8.792116370739002e-05
C5 -> C8, 6021999.999999999
C9 -> C1 + C5, 8.741489692811141e-05
C1 + C5 -> C9, 5.987323760986328
C9 -> C1 + C7, 1.0228677142932722e-62
C1 + C7 -> C9, 5.970458984375
C9 -> C1 + C6, 2.671587076005605e-29
C1 + C6 -> C9, 5.942883014678955
C10 -> C3 + C3, 8.724851703276327e-05
C3 + C3 -> C10, 5.975927829742432
C10 -> C1 + C6, 1.0228677142932722e-62
C1 + C6 -> C10, 5.970458984375
C11 -> C1 + C6, 8.741489692811141e-05
C1 + C6 -> C11, 5.987323760986328
C11 -> C4 + C4, 1.0199595902638853e-62
C4 + C4 -> C11, 5.953484058380127
C12 -> C1 + C7, 8.741489692811141e-05
C1 + C7 -> C12, 5.987323760986328
C12 -> C4 + C4, 2.6599452236998284e-29
C4 + C4 -> C12, 5.916985988616943
C13 -> C2 + C2, 8.724614412995706e-05
C2 + C2 -> C13, 5.975765705108643
C13 -> C1 + C7, 2.671587076005605e-29
C1 + C7 -> C13, 5.942883014678955
C14 -> C1 + C5, 1.0228677142932722e-62
C1 + C5 -> C14, 5.970458984375
C14 -> C3 + C3, 2.6600136398810767e-29
C3 + C3 -> C14, 5.917138576507568
C15 -> C2 + C2, 1.0199354846243686e-62
C2 + C2 -> C15, 5.953343391418457
C15 -> C1 + C5, 2.671587076005605e-29
C1 + C5 -> C15, 5.942883014678955
C16 -> C14, 8.792116370739002e-05
C14 -> C16, 6021999.999999999
C16 -> C1 + C8, 1.0228677142932722e-62
C1 + C8 -> C16, 5.970458984375
C16 -> C10, 2.707153421458248e-29
C10 -> C16, 6021999.999999999
C16 -> C9, 1.0316977576338455e-62
C9 -> C16, 6021999.999999999
C17 -> C1 + C8, 8.741489692811141e-05
C1 + C8 -> C17, 5.987323760986328
C17 -> C12, 1.0316977576338455e-62
C12 -> C17, 6021999.999999999
C17 -> C11, 2.707153421458248e-29
C11 -> C17, 6021999.999999999
C17 -> C9, 8.792116370739002e-05
C9 -> C17, 6021999.999999999
C18 -> C15, 8.792116370739002e-05
C15 -> C18, 6021999.999999999
C18 -> C13, 1.0316977576338455e-62
C13 -> C18, 6021999.999999999
C18 -> C1 + C8, 2.671587076005605e-29
C1 + C8 -> C18, 5.942883014678955
C18 -> C9, 2.707153421458248e-29
C9 -> C18, 6021999.999999999
C19 -> C10, 8.792116370739002e-05
C10 -> C19, 6021999.999999999
C19 -> C11, 1.0316977576338455e-62
C11 -> C19, 6021999.999999999
C20 -> C13, 8.792116370739002e-05
C13 -> C20, 6021999.999999999
C20 -> C12, 2.707153421458248e-29
C12 -> C20, 6021999.999999999
C21 -> C15, 1.0316977576338455e-62
C15 -> C21, 6021999.999999999
C21 -> C14, 2.707153421458248e-29
C14 -> C21, 6021999.999999999
C22 -> C16, 8.792116370739002e-05
C16 -> C22, 6021999.999999999
C22 -> C17, 1.0316977576338455e-62
C17 -> C22, 6021999.999999999
C22 -> C19, 2.707153421458248e-29
C19 -> C22, 6021999.999999999
C23 -> C21, 8.792116370739002e-05
C21 -> C23, 6021999.999999999
C23 -> C18, 1.0316977576338455e-62
C18 -> C23, 6021999.999999999
C23 -> C16, 2.707153421458248e-29
C16 -> C23, 6021999.999999999
C24 -> C18, 8.792116370739002e-05
C18 -> C24, 6021999.999999999
C24 -> C20, 1.0316977576338455e-62
C20 -> C24, 6021999.999999999
C24 -> C17, 2.707153421458248e-29
C17 -> C24, 6021999.999999999
C25 -> C23, 8.792116370739002e-05
C23 -> C25, 6021999.999999999
C25 -> C24, 1.0316977576338455e-62
C24 -> C25, 6021999.999999999
C25 -> C22, 2.707153421458248e-29
C22 -> C25, 6021999.999999999
Complex species: 25
C1, A
C2, A-A, linear, A(A1) + A(A1) <-> A(A1!1).A(A1!1)
C3, A-A, linear, A(A2) + A(A2) <-> A(A2!1).A(A2!1)
C4, A-A, linear, A(A3) + A(A3) <-> A(A3!1).A(A3!1)
C5, A-A-A, linear, A(A1) + A(A1) <-> A(A1!1).A(A1!1), A(A2) + A(A2) <-> A(A2!1).A(A2!1)
C6, A-A-A, linear, A(A2) + A(A2) <-> A(A2!1).A(A2!1), A(A3) + A(A3) <-> A(A3!1).A(A3!1)
C7, A-A-A, linear, A(A1) + A(A1) <-> A(A1!1).A(A1!1), A(A3) + A(A3) <-> A(A3!1).A(A3!1)
C8, A-A-A, cyclic, A(A1) + A(A1) <-> A(A1!1).A(A1!1), A(A2) + A(A2) <-> A(A2!1).A(A2!1), A(A3) + A(A3) <-> A(A3!1).A(A3!1)
C9, A-A-A-A, branched, A(A1) + A(A1) <-> A(A1!1).A(A1!1), A(A2) + A(A2) <-> A(A2!1).A(A2!1), A(A3) + A(A3) <-> A(A3!1).A(A3!1)
C10, A-A-A-A, linear, A(A2) + A(A2) <-> A(A2!1).A(A2!1), A(A2) + A(A2) <-> A(A2!1).A(A2!1), A(A3) + A(A3) <-> A(A3!1).A(A3!1)
C11, A-A-A-A, linear, A(A2) + A(A2) <-> A(A2!1).A(A2!1), A(A3) + A(A3) <-> A(A3!1).A(A3!1), A(A3) + A(A3) <-> A(A3!1).A(A3!1)
C12, A-A-A-A, linear, A(A1) + A(A1) <-> A(A1!1).A(A1!1), A(A3) + A(A3) <-> A(A3!1).A(A3!1), A(A3) + A(A3) <-> A(A3!1).A(A3!1)
C13, A-A-A-A, linear, A(A1) + A(A1) <-> A(A1!1).A(A1!1), A(A1) + A(A1) <-> A(A1!1).A(A1!1), A(A3) + A(A3) <-> A(A3!1).A(A3!1)
C14, A-A-A-A, linear, A(A1) + A(A1) <-> A(A1!1).A(A1!1), A(A2) + A(A2) <-> A(A2!1).A(A2!1), A(A2) + A(A2) <-> A(A2!1).A(A2!1)
C15, A-A-A-A, linear, A(A1) + A(A1) <-> A(A1!1).A(A1!1), A(A1) + A(A1) <-> A(A1!1).A(A1!1), A(A2) + A(A2) <-> A(A2!1).A(A2!1)
C16, A-A-A-A, branched, A(A1) + A(A1) <-> A(A1!1).A(A1!1), A(A2) + A(A2) <-> A(A2!1).A(A2!1), A(A2) + A(A2) <-> A(A2!1).A(A2!1), A(A3) + A(A3) <-> A(A3!1).A(A3!1)
C17, A-A-A-A, branched, A(A1) + A(A1) <-> A(A1!1).A(A1!1), A(A2) + A(A2) <-> A(A2!1).A(A2!1), A(A3) + A(A3) <-> A(A3!1).A(A3!1), A(A3) + A(A3) <-> A(A3!1).A(A3!1)
C18, A-A-A-A, branched, A(A1) + A(A1) <-> A(A1!1).A(A1!1), A(A1) + A(A1) <-> A(A1!1).A(A1!1), A(A2) + A(A2) <-> A(A2!1).A(A2!1), A(A3) + A(A3) <-> A(A3!1).A(A3!1)
C19, A-A-A-A, cyclic, A(A2) + A(A2) <-> A(A2!1).A(A2!1), A(A2) + A(A2) <-> A(A2!1).A(A2!1), A(A3) + A(A3) <-> A(A3!1).A(A3!1), A(A3) + A(A3) <-> A(A3!1).A(A3!1)
C20, A-A-A-A, cyclic, A(A1) + A(A1) <-> A(A1!1).A(A1!1), A(A1) + A(A1) <-> A(A1!1).A(A1!1), A(A3) + A(A3) <-> A(A3!1).A(A3!1), A(A3) + A(A3) <-> A(A3!1).A(A3!1)
C21, A-A-A-A, cyclic, A(A1) + A(A1) <-> A(A1!1).A(A1!1), A(A1) + A(A1) <-> A(A1!1).A(A1!1), A(A2) + A(A2) <-> A(A2!1).A(A2!1), A(A2) + A(A2) <-> A(A2!1).A(A2!1)
C22, A-A-A-A, branched, A(A1) + A(A1) <-> A(A1!1).A(A1!1), A(A2) + A(A2) <-> A(A2!1).A(A2!1), A(A2) + A(A2) <-> A(A2!1).A(A2!1), A(A3) + A(A3) <-> A(A3!1).A(A3!1), A(A3) + A(A3) <-> A(A3!1).A(A3!1)
C23, A-A-A-A, branched, A(A1) + A(A1) <-> A(A1!1).A(A1!1), A(A1) + A(A1) <-> A(A1!1).A(A1!1), A(A2) + A(A2) <-> A(A2!1).A(A2!1), A(A2) + A(A2) <-> A(A2!1).A(A2!1), A(A3) + A(A3) <-> A(A3!1).A(A3!1)
C24, A-A-A-A, branched, A(A1) + A(A1) <-> A(A1!1).A(A1!1), A(A1) + A(A1) <-> A(A1!1).A(A1!1), A(A2) + A(A2) <-> A(A2!1).A(A2!1), A(A3) + A(A3) <-> A(A3!1).A(A3!1), A(A3) + A(A3) <-> A(A3!1).A(A3!1)
C25, A-A-A-A, branched, A(A1) + A(A1) <-> A(A1!1).A(A1!1), A(A1) + A(A1) <-> A(A1!1).A(A1!1), A(A2) + A(A2) <-> A(A2!1).A(A2!1), A(A2) + A(A2) <-> A(A2!1).A(A2!1), A(A3) + A(A3) <-> A(A3!1).A(A3!1), A(A3) + A(A3) <-> A(A3!1).A(A3!1)
[5]:
for complex in complex_list:
    print(complex)
C1, A
C2, A-A, linear, A(A1) + A(A1) <-> A(A1!1).A(A1!1)
C3, A-A, linear, A(A2) + A(A2) <-> A(A2!1).A(A2!1)
C4, A-A, linear, A(A3) + A(A3) <-> A(A3!1).A(A3!1)
C5, A-A-A, linear, A(A1) + A(A1) <-> A(A1!1).A(A1!1), A(A2) + A(A2) <-> A(A2!1).A(A2!1)
C6, A-A-A, linear, A(A2) + A(A2) <-> A(A2!1).A(A2!1), A(A3) + A(A3) <-> A(A3!1).A(A3!1)
C7, A-A-A, linear, A(A1) + A(A1) <-> A(A1!1).A(A1!1), A(A3) + A(A3) <-> A(A3!1).A(A3!1)
C8, A-A-A, cyclic, A(A1) + A(A1) <-> A(A1!1).A(A1!1), A(A2) + A(A2) <-> A(A2!1).A(A2!1), A(A3) + A(A3) <-> A(A3!1).A(A3!1)
C9, A-A-A-A, branched, A(A1) + A(A1) <-> A(A1!1).A(A1!1), A(A2) + A(A2) <-> A(A2!1).A(A2!1), A(A3) + A(A3) <-> A(A3!1).A(A3!1)
C10, A-A-A-A, linear, A(A2) + A(A2) <-> A(A2!1).A(A2!1), A(A2) + A(A2) <-> A(A2!1).A(A2!1), A(A3) + A(A3) <-> A(A3!1).A(A3!1)
C11, A-A-A-A, linear, A(A2) + A(A2) <-> A(A2!1).A(A2!1), A(A3) + A(A3) <-> A(A3!1).A(A3!1), A(A3) + A(A3) <-> A(A3!1).A(A3!1)
C12, A-A-A-A, linear, A(A1) + A(A1) <-> A(A1!1).A(A1!1), A(A3) + A(A3) <-> A(A3!1).A(A3!1), A(A3) + A(A3) <-> A(A3!1).A(A3!1)
C13, A-A-A-A, linear, A(A1) + A(A1) <-> A(A1!1).A(A1!1), A(A1) + A(A1) <-> A(A1!1).A(A1!1), A(A3) + A(A3) <-> A(A3!1).A(A3!1)
C14, A-A-A-A, linear, A(A1) + A(A1) <-> A(A1!1).A(A1!1), A(A2) + A(A2) <-> A(A2!1).A(A2!1), A(A2) + A(A2) <-> A(A2!1).A(A2!1)
C15, A-A-A-A, linear, A(A1) + A(A1) <-> A(A1!1).A(A1!1), A(A1) + A(A1) <-> A(A1!1).A(A1!1), A(A2) + A(A2) <-> A(A2!1).A(A2!1)
C16, A-A-A-A, branched, A(A1) + A(A1) <-> A(A1!1).A(A1!1), A(A2) + A(A2) <-> A(A2!1).A(A2!1), A(A2) + A(A2) <-> A(A2!1).A(A2!1), A(A3) + A(A3) <-> A(A3!1).A(A3!1)
C17, A-A-A-A, branched, A(A1) + A(A1) <-> A(A1!1).A(A1!1), A(A2) + A(A2) <-> A(A2!1).A(A2!1), A(A3) + A(A3) <-> A(A3!1).A(A3!1), A(A3) + A(A3) <-> A(A3!1).A(A3!1)
C18, A-A-A-A, branched, A(A1) + A(A1) <-> A(A1!1).A(A1!1), A(A1) + A(A1) <-> A(A1!1).A(A1!1), A(A2) + A(A2) <-> A(A2!1).A(A2!1), A(A3) + A(A3) <-> A(A3!1).A(A3!1)
C19, A-A-A-A, cyclic, A(A2) + A(A2) <-> A(A2!1).A(A2!1), A(A2) + A(A2) <-> A(A2!1).A(A2!1), A(A3) + A(A3) <-> A(A3!1).A(A3!1), A(A3) + A(A3) <-> A(A3!1).A(A3!1)
C20, A-A-A-A, cyclic, A(A1) + A(A1) <-> A(A1!1).A(A1!1), A(A1) + A(A1) <-> A(A1!1).A(A1!1), A(A3) + A(A3) <-> A(A3!1).A(A3!1), A(A3) + A(A3) <-> A(A3!1).A(A3!1)
C21, A-A-A-A, cyclic, A(A1) + A(A1) <-> A(A1!1).A(A1!1), A(A1) + A(A1) <-> A(A1!1).A(A1!1), A(A2) + A(A2) <-> A(A2!1).A(A2!1), A(A2) + A(A2) <-> A(A2!1).A(A2!1)
C22, A-A-A-A, branched, A(A1) + A(A1) <-> A(A1!1).A(A1!1), A(A2) + A(A2) <-> A(A2!1).A(A2!1), A(A2) + A(A2) <-> A(A2!1).A(A2!1), A(A3) + A(A3) <-> A(A3!1).A(A3!1), A(A3) + A(A3) <-> A(A3!1).A(A3!1)
C23, A-A-A-A, branched, A(A1) + A(A1) <-> A(A1!1).A(A1!1), A(A1) + A(A1) <-> A(A1!1).A(A1!1), A(A2) + A(A2) <-> A(A2!1).A(A2!1), A(A2) + A(A2) <-> A(A2!1).A(A2!1), A(A3) + A(A3) <-> A(A3!1).A(A3!1)
C24, A-A-A-A, branched, A(A1) + A(A1) <-> A(A1!1).A(A1!1), A(A1) + A(A1) <-> A(A1!1).A(A1!1), A(A2) + A(A2) <-> A(A2!1).A(A2!1), A(A3) + A(A3) <-> A(A3!1).A(A3!1), A(A3) + A(A3) <-> A(A3!1).A(A3!1)
C25, A-A-A-A, branched, A(A1) + A(A1) <-> A(A1!1).A(A1!1), A(A1) + A(A1) <-> A(A1!1).A(A1!1), A(A2) + A(A2) <-> A(A2!1).A(A2!1), A(A2) + A(A2) <-> A(A2!1).A(A2!1), A(A3) + A(A3) <-> A(A3!1).A(A3!1), A(A3) + A(A3) <-> A(A3!1).A(A3!1)
[6]:
from ionerdss import ReactionStringParser

# initialize an instance of reaction_string_parser
rsp = ReactionStringParser()

reaction_strings = [reaction.expression for reaction in complex_reaction_system.reactions]
species_names, rate_constant_names, reactant_matrix, product_matrix =\
        rsp.parse_reaction_strings(reaction_strings)

print("Species Names:")
print(species_names)
print("Reactant Stoichiometry Matrix:")
print(reactant_matrix)
print("Product Stoichiometry Matrix:")
print(product_matrix)
print("Rate Constant Values: Placeholder. for future use, I think rate constant not from string is better for now?")
print("Rate Constant Names:")
print(rate_constant_names)
Species Names:
['C1' 'C10' 'C11' 'C12' 'C13' 'C14' 'C15' 'C16' 'C17' 'C18' 'C19' 'C2'
 'C20' 'C21' 'C22' 'C23' 'C24' 'C25' 'C3' 'C4' 'C5' 'C6' 'C7' 'C8' 'C9']
Reactant Stoichiometry Matrix:
[[0 0 0 ... 0 0 0]
 [2 0 0 ... 0 0 0]
 [0 0 0 ... 0 0 0]
 ...
 [0 0 0 ... 0 0 0]
 [0 0 0 ... 0 0 0]
 [0 0 0 ... 0 0 0]]
Product Stoichiometry Matrix:
[[2 0 0 ... 0 0 0]
 [0 0 0 ... 0 0 0]
 [2 0 0 ... 0 0 0]
 ...
 [0 0 0 ... 0 0 0]
 [0 0 0 ... 0 0 0]
 [0 0 0 ... 0 0 0]]
Rate Constant Values: Placeholder. for future use, I think rate constant not from string is better for now?
Rate Constant Names:
['k0', 'k1', 'k2', 'k3', 'k4', 'k5', 'k6', 'k7', 'k8', 'k9', 'k10', 'k11', 'k12', 'k13', 'k14', 'k15', 'k16', 'k17', 'k18', 'k19', 'k20', 'k21', 'k22', 'k23', 'k24', 'k25', 'k26', 'k27', 'k28', 'k29', 'k30', 'k31', 'k32', 'k33', 'k34', 'k35', 'k36', 'k37', 'k38', 'k39', 'k40', 'k41', 'k42', 'k43', 'k44', 'k45', 'k46', 'k47', 'k48', 'k49', 'k50', 'k51', 'k52', 'k53', 'k54', 'k55', 'k56', 'k57', 'k58', 'k59', 'k60', 'k61', 'k62', 'k63', 'k64', 'k65', 'k66', 'k67', 'k68', 'k69', 'k70', 'k71', 'k72', 'k73', 'k74', 'k75', 'k76', 'k77', 'k78', 'k79', 'k80', 'k81', 'k82', 'k83', 'k84', 'k85', 'k86', 'k87', 'k88', 'k89', 'k90', 'k91', 'k92', 'k93', 'k94', 'k95', 'k96', 'k97', 'k98', 'k99', 'k100', 'k101', 'k102', 'k103', 'k104', 'k105', 'k106', 'k107', 'k108', 'k109', 'k110', 'k111', 'k112', 'k113']
[7]:
from ionerdss import solve_reaction_ode, reaction_dydt
import numpy as np

# Rate constant assuming already non-dimensionalized
rate_constants = [reaction.rate for reaction in complex_reaction_system.reactions]

# Define time span and initial concentration, assuming already non-dimensionalized
t_span = [0.0, 10.0]
y_init = np.zeros(25) # initial concentration
y_init[0] = 1.0

time, concentrations, species_names = solve_reaction_ode(reaction_dydt, t_span,  y_init, reactant_matrix = reactant_matrix, product_matrix = product_matrix,
                                             k = rate_constants, method = "BDF",
                                             species_names = species_names)
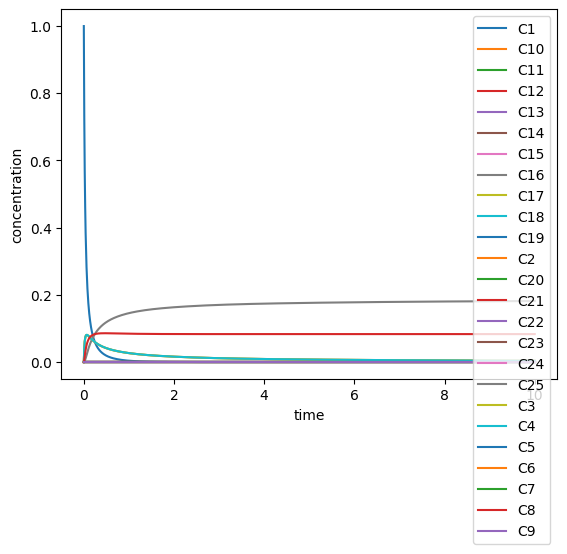
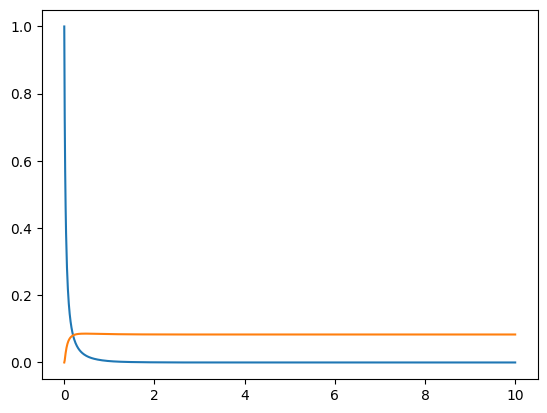
[8]:
import matplotlib.pyplot as plt
plt.plot(time,((concentrations.T)[0]).T)
plt.plot(time,((concentrations.T)[23]).T)
[8]:
[<matplotlib.lines.Line2D at 0x147710370>]
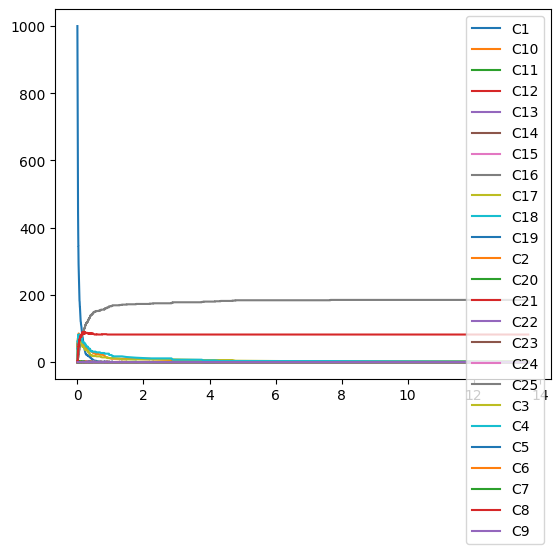
[12]:
from ionerdss import SimpleGillespieSimulator

# Example usage:
# Generate reaction syst
print("Species Names:")
print(species_names)
print("Rate Constant Names:")
print(rate_constant_names)

sgs = SimpleGillespieSimulator()

# Convert rate constant to microscopic assuming already non-dimensionalized
volume =1e-21 # Litre
macroscopic_rate_constants = [reaction.rate for reaction in complex_reaction_system.reactions]
microscopic_rate_constants = \
    sgs.convert_to_microscopic_rate_constants(macroscopic_rate_constants, reactant_matrix, volume)

# Define time and copy number, assuming already non-dimensionalized
tot_time = 10
y_init = np.zeros(25, dtype = int)
y_init[0] = 1000

# Run gillespie
y_record, t_record = sgs.gillespie_simulation(tot_time, y_init, reactant_matrix,
                                          product_matrix, microscopic_rate_constants)

# plotting
import matplotlib.pyplot as plt
plt.plot(t_record, y_record)
plt.legend(species_names)
Species Names:
['C1' 'C10' 'C11' 'C12' 'C13' 'C14' 'C15' 'C16' 'C17' 'C18' 'C19' 'C2'
 'C20' 'C21' 'C22' 'C23' 'C24' 'C25' 'C3' 'C4' 'C5' 'C6' 'C7' 'C8' 'C9']
Rate Constant Names:
['k0', 'k1', 'k2', 'k3', 'k4', 'k5', 'k6', 'k7', 'k8', 'k9', 'k10', 'k11', 'k12', 'k13', 'k14', 'k15', 'k16', 'k17', 'k18', 'k19', 'k20', 'k21', 'k22', 'k23', 'k24', 'k25', 'k26', 'k27', 'k28', 'k29', 'k30', 'k31', 'k32', 'k33', 'k34', 'k35', 'k36', 'k37', 'k38', 'k39', 'k40', 'k41', 'k42', 'k43', 'k44', 'k45', 'k46', 'k47', 'k48', 'k49', 'k50', 'k51', 'k52', 'k53', 'k54', 'k55', 'k56', 'k57', 'k58', 'k59', 'k60', 'k61', 'k62', 'k63', 'k64', 'k65', 'k66', 'k67', 'k68', 'k69', 'k70', 'k71', 'k72', 'k73', 'k74', 'k75', 'k76', 'k77', 'k78', 'k79', 'k80', 'k81', 'k82', 'k83', 'k84', 'k85', 'k86', 'k87', 'k88', 'k89', 'k90', 'k91', 'k92', 'k93', 'k94', 'k95', 'k96', 'k97', 'k98', 'k99', 'k100', 'k101', 'k102', 'k103', 'k104', 'k105', 'k106', 'k107', 'k108', 'k109', 'k110', 'k111', 'k112', 'k113']
[12]:
<matplotlib.legend.Legend at 0x147717790>
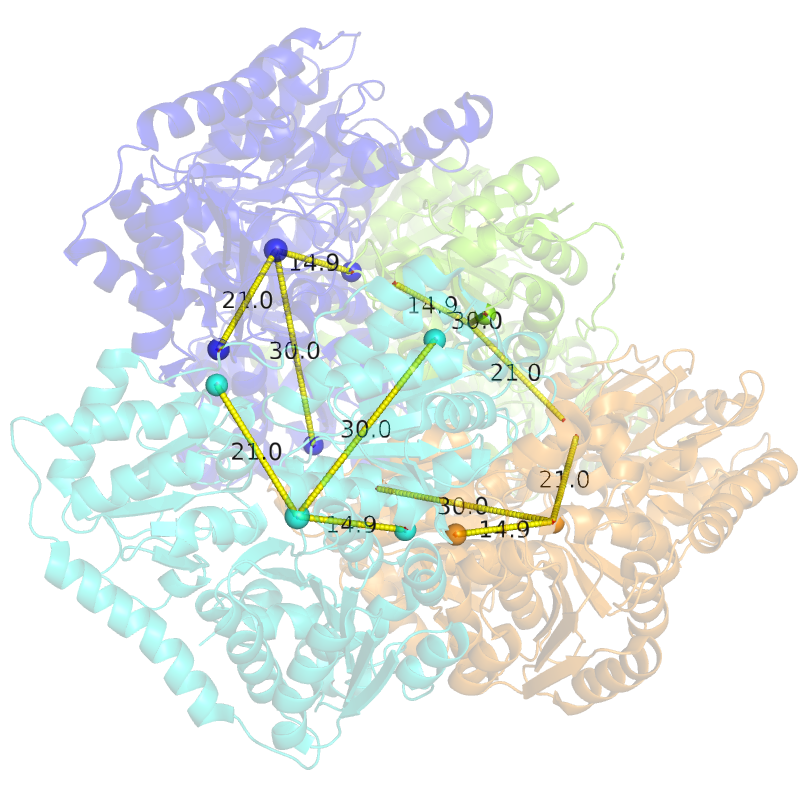
[5]:
if save_folder.startswith('~'):
    abs_save_folder = os.path.expanduser(save_folder)
abs_save_folder = os.path.abspath(abs_save_folder)

subprocess.run(["pymol", "-cq", f"{abs_save_folder}/visualize_regularized_coarse_grained.pml"], check=True)
display(Image(filename=f"{abs_save_folder}/comparison_regularized.png"))
PyMOL>load /Users/sikao/Documents/8y7s_dir/regularized_coarse_grained_structure.cif, coarse_grained
 ExecutiveLoad-Detail: Detected mmCIF
 CmdLoad: "/Users/sikao/Documents/8y7s_dir/regularized_coarse_grained_structure.cif" loaded as "coarse_grained".
PyMOL>hide everything
PyMOL>show spheres, name COM
PyMOL>show spheres, name INT
PyMOL>set sphere_scale, 1.0
 Setting: sphere_scale set to 1.00000.
PyMOL>color red, name COM
 Executive: Colored 4 atoms.
PyMOL>color blue, name INT
 Executive: Colored 12 atoms.
PyMOL>pseudoatom com_A, pos=[-34.339, 24.679, 53.314], color=red
 ObjMol: created com_A/PSDO/P/PSD`1 /PS1
PyMOL>pseudoatom int_A_1, pos=[-41.347, 10.365, 67.061], color=blue
 ObjMol: created int_A_1/PSDO/P/PSD`1 /PS1
PyMOL>distance line1, com_A, int_A_1
 Executive: object "line1" created.
PyMOL>set dash_width, 4, line1
 Setting: dash_width set to 4.00000 in object "line1".
PyMOL>set dash_gap, 0.5, line1
 Setting: dash_gap set to 0.50000 in object "line1".
PyMOL>pseudoatom int_A_2, pos=[-23.852, 22.231, 42.947], color=blue
 ObjMol: created int_A_2/PSDO/P/PSD`1 /PS1
PyMOL>distance line2, com_A, int_A_2
 Executive: object "line2" created.
PyMOL>set dash_width, 4, line2
 Setting: dash_width set to 4.00000 in object "line2".
PyMOL>set dash_gap, 0.5, line2
 Setting: dash_gap set to 0.50000 in object "line2".
PyMOL>pseudoatom int_A_3, pos=[-29.410, -3.090, 42.992], color=blue
 ObjMol: created int_A_3/PSDO/P/PSD`1 /PS1
PyMOL>distance line3, com_A, int_A_3
 Executive: object "line3" created.
PyMOL>set dash_width, 4, line3
 Setting: dash_width set to 4.00000 in object "line3".
PyMOL>set dash_gap, 0.5, line3
 Setting: dash_gap set to 0.50000 in object "line3".
PyMOL>pseudoatom com_B, pos=[-30.466, -12.043, 71.767], color=red
 ObjMol: created com_B/PSDO/P/PSD`1 /PS1
PyMOL>pseudoatom int_B_1, pos=[-41.499, 5.517, 68.172], color=blue
 ObjMol: created int_B_1/PSDO/P/PSD`1 /PS1
PyMOL>distance line4, com_B, int_B_1
 Executive: object "line4" created.
PyMOL>set dash_width, 4, line4
 Setting: dash_width set to 4.00000 in object "line4".
PyMOL>set dash_gap, 0.5, line4
 Setting: dash_gap set to 0.50000 in object "line4".
PyMOL>pseudoatom int_B_2, pos=[-12.083, 11.565, 69.178], color=blue
 ObjMol: created int_B_2/PSDO/P/PSD`1 /PS1
PyMOL>distance line5, com_B, int_B_2
 Executive: object "line5" created.
PyMOL>set dash_width, 4, line5
 Setting: dash_width set to 4.00000 in object "line5".
PyMOL>set dash_gap, 0.5, line5
 Setting: dash_gap set to 0.50000 in object "line5".
PyMOL>pseudoatom int_B_3, pos=[-16.078, -14.032, 68.236], color=blue
 ObjMol: created int_B_3/PSDO/P/PSD`1 /PS1
PyMOL>distance line6, com_B, int_B_3
 Executive: object "line6" created.
PyMOL>set dash_width, 4, line6
 Setting: dash_width set to 4.00000 in object "line6".
PyMOL>set dash_gap, 0.5, line6
 Setting: dash_gap set to 0.50000 in object "line6".
PyMOL>pseudoatom com_E, pos=[-6.219, 15.027, 30.937], color=red
 ObjMol: created com_E/PSDO/P/PSD`1 /PS1
PyMOL>pseudoatom int_E_1, pos=[-17.517, 20.722, 38.896], color=blue
 ObjMol: created int_E_1/PSDO/P/PSD`1 /PS1
PyMOL>distance line7, com_E, int_E_1
 Executive: object "line7" created.
PyMOL>set dash_width, 4, line7
 Setting: dash_width set to 4.00000 in object "line7".
PyMOL>set dash_gap, 0.5, line7
 Setting: dash_gap set to 0.50000 in object "line7".
PyMOL>pseudoatom int_E_2, pos=[-4.978, 15.356, 60.943], color=blue
 ObjMol: created int_E_2/PSDO/P/PSD`1 /PS1
PyMOL>distance line8, com_E, int_E_2
 Executive: object "line8" created.
PyMOL>set dash_width, 4, line8
 Setting: dash_width set to 4.00000 in object "line8".
PyMOL>set dash_gap, 0.5, line8
 Setting: dash_gap set to 0.50000 in object "line8".
PyMOL>pseudoatom int_E_3, pos=[7.427, 0.593, 37.898], color=blue
 ObjMol: created int_E_3/PSDO/P/PSD`1 /PS1
PyMOL>distance line9, com_E, int_E_3
 Executive: object "line9" created.
PyMOL>set dash_width, 4, line9
 Setting: dash_width set to 4.00000 in object "line9".
PyMOL>set dash_gap, 0.5, line9
 Setting: dash_gap set to 0.50000 in object "line9".
PyMOL>pseudoatom com_F, pos=[4.472, -13.414, 58.952], color=red
 ObjMol: created com_F/PSDO/P/PSD`1 /PS1
PyMOL>pseudoatom int_F_1, pos=[-20.001, -9.501, 41.989], color=blue
 ObjMol: created int_F_1/PSDO/P/PSD`1 /PS1
PyMOL>distance line10, com_F, int_F_1
 Executive: object "line10" created.
PyMOL>set dash_width, 4, line10
 Setting: dash_width set to 4.00000 in object "line10".
PyMOL>set dash_gap, 0.5, line10
 Setting: dash_gap set to 0.50000 in object "line10".
PyMOL>pseudoatom int_F_2, pos=[-9.157, -14.873, 64.915], color=blue
 ObjMol: created int_F_2/PSDO/P/PSD`1 /PS1
PyMOL>distance line11, com_F, int_F_2
 Executive: object "line11" created.
PyMOL>set dash_width, 4, line11
 Setting: dash_width set to 4.00000 in object "line11".
PyMOL>set dash_gap, 0.5, line11
 Setting: dash_gap set to 0.50000 in object "line11".
PyMOL>pseudoatom int_F_3, pos=[9.073, -1.916, 41.935], color=blue
 ObjMol: created int_F_3/PSDO/P/PSD`1 /PS1
PyMOL>distance line12, com_F, int_F_3
 Executive: object "line12" created.
PyMOL>set dash_width, 4, line12
 Setting: dash_width set to 4.00000 in object "line12".
PyMOL>set dash_gap, 0.5, line12
 Setting: dash_gap set to 0.50000 in object "line12".
PyMOL>set sphere_transparency, 0.2
 Setting: sphere_transparency set to 0.20000.
PyMOL>bg_color white
PyMOL>zoom all
PyMOL>load /Users/sikao/Documents/8y7s_dir/8y7s.cif
TITLE     Crystal structure of a benzaldehyde lyase mutant M6 from Herbiconiux sp. SALV-R1
 ExecutiveLoad-Detail: Detected mmCIF
 CmdLoad: "/Users/sikao/Documents/8y7s_dir/8y7s.cif" loaded as "8y7s".
PyMOL>spectrum chain
 Spectrum: Expression is non-numeric, enumerating values
 Spectrum: range ( 0.00000 to  4.00000).
PyMOL>hide everything, 8y7s
PyMOL>show cartoon, 8y7s
PyMOL>set cartoon_transparency, 0.7, 8y7s
 Setting: cartoon_transparency set to 0.70000 in object "8y7s".
PyMOL>png /Users/sikao/Documents/8y7s_dir/comparison_regularized.png, 800, 800, 150, 1
 Ray: render time: 4.39 sec. = 819.8 frames/hour (4.39 sec. accum.).
 ScenePNG: wrote 800x800 pixel image to file "/Users/sikao/Documents/8y7s_dir/comparison_regularized.png".
[ ]:
simulation = ion.Simulation(pdb_model, save_folder)
[ ]:
simulation.generate_nerdss_input()
[ ]:
simulation.modify_mol_file('A',
                           {'D': [20.0, 20.0, 20.0],
                            'Dr': [0.2, 0.2, 0.2]}) # Example modification

simulation.print_mol_parameters('A')
[ ]:
simulation.modify_inp_file({'nItr': 1000, 'timeStep': 0.5, 'timeWrite': 100, 'trajWrite': 100, 'pdbWrite': 100, 'A': 200, 'A(A1) + A(A1) <-> A(A1!1).A(A1!1)': {'onRate3Dka': 2000}}) # Example modification
simulation.print_inp_file()
[ ]:
simulation.install_nerdss(nerdss_path="~/Documents/8y7s_dir") # this will update the nerdss folder if it already exists
[ ]:
simulation.run_new_simulations(sim_indices=[1, 2, 3],
                              sim_dir="~/Documents/8y7s_dir/nerdss_output",
                              nerdss_dir="~/Documents/8y7s_dir/NERDSS",
                              parallel=False)
[2]:
analysis = ion.Analyzer("./data/8y7s_dir/nerdss_output/")
Detected a batch of 3 simulation directories.
[3]:
analysis.visualize_trajectory()
objc[75699]: Class QDarwinBluetoothPermissionHandler is implemented in both /Users/sikao/anaconda3/envs/local_nerdss/lib/python3.9/site-packages/PyQt6/QtCore.abi3.so (0x118946ed0) and /Users/sikao/anaconda3/envs/local_nerdss/lib/python3.9/site-packages/PySide6/QtCore.abi3.so (0x15d6bf370). One of the two will be used. Which one is undefined.
objc[75699]: Class QDarwinCalendarPermissionHandler is implemented in both /Users/sikao/anaconda3/envs/local_nerdss/lib/python3.9/site-packages/PyQt6/QtCore.abi3.so (0x118946f48) and /Users/sikao/anaconda3/envs/local_nerdss/lib/python3.9/site-packages/PySide6/QtCore.abi3.so (0x15d6bf3e8). One of the two will be used. Which one is undefined.
objc[75699]: Class QDarwinCameraPermissionHandler is implemented in both /Users/sikao/anaconda3/envs/local_nerdss/lib/python3.9/site-packages/PyQt6/QtCore.abi3.so (0x118946f98) and /Users/sikao/anaconda3/envs/local_nerdss/lib/python3.9/site-packages/PySide6/QtCore.abi3.so (0x15d6bf438). One of the two will be used. Which one is undefined.
objc[75699]: Class QDarwinContactsPermissionHandler is implemented in both /Users/sikao/anaconda3/envs/local_nerdss/lib/python3.9/site-packages/PyQt6/QtCore.abi3.so (0x118946fe8) and /Users/sikao/anaconda3/envs/local_nerdss/lib/python3.9/site-packages/PySide6/QtCore.abi3.so (0x15d6bf488). One of the two will be used. Which one is undefined.
objc[75699]: Class QDarwinMicrophonePermissionHandler is implemented in both /Users/sikao/anaconda3/envs/local_nerdss/lib/python3.9/site-packages/PyQt6/QtCore.abi3.so (0x118947088) and /Users/sikao/anaconda3/envs/local_nerdss/lib/python3.9/site-packages/PySide6/QtCore.abi3.so (0x15d6bf4d8). One of the two will be used. Which one is undefined.
<IPython.core.display.Image object>
[4]:
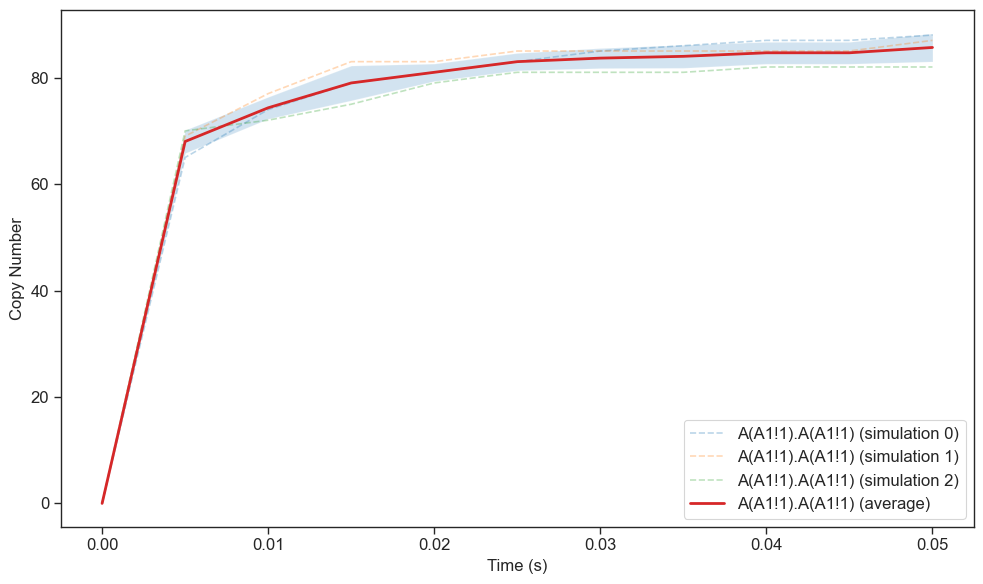
analysis.plot_figure(figure_type='line',
                     x='time',
                     y='species',
                     legend=[['A(A1!1).A(A1!1)'],],
                     show_type='both')
No simulations specified. Using all available simulations.
Plotting line with:
- x-axis: time
- y-axis: species
- z-axis: None
- Simulations: 3 selected
- Legend: [['A(A1!1).A(A1!1)']]
- Display mode: both
Processed data for A(A1!1).A(A1!1) saved to /Users/sikao/Documents/GitHub/ionerdss/data/8y7s_dir/nerdss_output/figure_plot_data/A(A1!1).A(A1!1).csv
Plot saved to /Users/sikao/Documents/GitHub/ionerdss/data/8y7s_dir/nerdss_output/figure_plot_data/species_vs_time_plot.svg
Plot saved to /Users/sikao/Documents/GitHub/ionerdss/data/8y7s_dir/nerdss_output/figure_plot_data/species_vs_time_plot.svg
[5]:
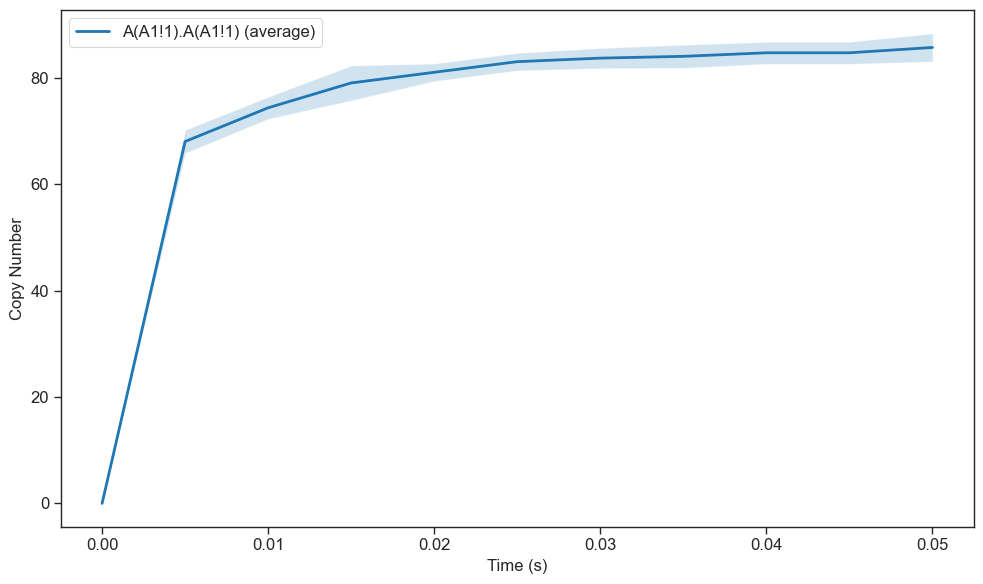
analysis.plot_figure(figure_type='line',
                     x='time',
                     y='species',
                     legend=[['A(A1!1).A(A1!1)'],],
                     show_type='average')
No simulations specified. Using all available simulations.
Plotting line with:
- x-axis: time
- y-axis: species
- z-axis: None
- Simulations: 3 selected
- Legend: [['A(A1!1).A(A1!1)']]
- Display mode: average
Processed data for A(A1!1).A(A1!1) saved to /Users/sikao/Documents/GitHub/ionerdss/data/8y7s_dir/nerdss_output/figure_plot_data/A(A1!1).A(A1!1).csv
Plot saved to /Users/sikao/Documents/GitHub/ionerdss/data/8y7s_dir/nerdss_output/figure_plot_data/species_vs_time_plot.svg
Plot saved to /Users/sikao/Documents/GitHub/ionerdss/data/8y7s_dir/nerdss_output/figure_plot_data/species_vs_time_plot.svg
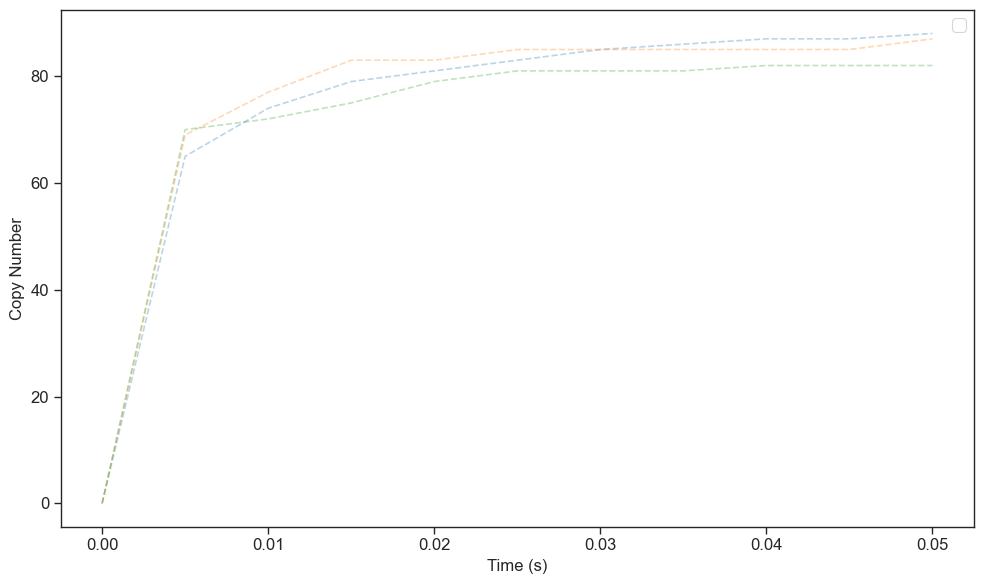
[7]:
analysis.plot_figure(figure_type='line',
                     x='time',
                     y='species',
                     legend=[['A(A1!1).A(A1!1)'],],
                     show_type='individuals')
No simulations specified. Using all available simulations.
Plotting line with:
- x-axis: time
- y-axis: species
- z-axis: None
- Simulations: 3 selected
- Legend: [['A(A1!1).A(A1!1)']]
- Display mode: individuals
Processed data for A(A1!1).A(A1!1) saved to /Users/sikao/Documents/GitHub/ionerdss/data/8y7s_dir/nerdss_output/figure_plot_data/A(A1!1).A(A1!1).csv
Plot saved to /Users/sikao/Documents/GitHub/ionerdss/data/8y7s_dir/nerdss_output/figure_plot_data/species_vs_time_plot.svg
/Users/sikao/Documents/GitHub/ionerdss/ionerdss/nerdss_analysis/plot_figures.py:99: UserWarning: No artists with labels found to put in legend.  Note that artists whose label start with an underscore are ignored when legend() is called with no argument.
  plt.legend()
Plot saved to /Users/sikao/Documents/GitHub/ionerdss/data/8y7s_dir/nerdss_output/figure_plot_data/species_vs_time_plot.svg
[8]:
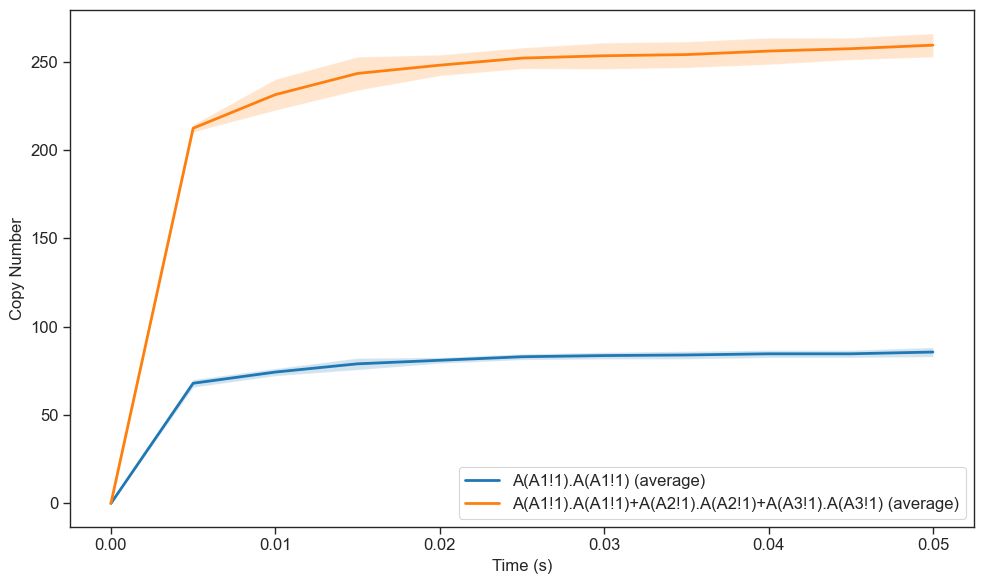
analysis.plot_figure(figure_type='line',
                     x='time',
                     y='species',
                     legend=[['A(A1!1).A(A1!1)'], ['A(A1!1).A(A1!1)', 'A(A2!1).A(A2!1)', 'A(A3!1).A(A3!1)'],],
                     show_type='average')
No simulations specified. Using all available simulations.
Plotting line with:
- x-axis: time
- y-axis: species
- z-axis: None
- Simulations: 3 selected
- Legend: [['A(A1!1).A(A1!1)'], ['A(A1!1).A(A1!1)', 'A(A2!1).A(A2!1)', 'A(A3!1).A(A3!1)']]
- Display mode: average
Processed data for A(A1!1).A(A1!1) saved to /Users/sikao/Documents/GitHub/ionerdss/data/8y7s_dir/nerdss_output/figure_plot_data/A(A1!1).A(A1!1).csv
Processed data for A(A1!1).A(A1!1)+A(A2!1).A(A2!1)+A(A3!1).A(A3!1) saved to /Users/sikao/Documents/GitHub/ionerdss/data/8y7s_dir/nerdss_output/figure_plot_data/A(A1!1).A(A1!1)_A(A2!1).A(A2!1)_A(A3!1).A(A3!1).csv
Plot saved to /Users/sikao/Documents/GitHub/ionerdss/data/8y7s_dir/nerdss_output/figure_plot_data/species_vs_time_plot.svg
Plot saved to /Users/sikao/Documents/GitHub/ionerdss/data/8y7s_dir/nerdss_output/figure_plot_data/species_vs_time_plot.svg
[3]:
analysis.plot_figure(figure_type='line',
                     x='time',
                     y='maximum_assembly',
                     legend=['A',],
                     show_type='average')
No simulations specified. Using all available simulations.
Plotting line with:
- x-axis: time
- y-axis: maximum_assembly
- z-axis: None
- Simulations: 3 selected
- Legend: ['A']
- Display mode: average
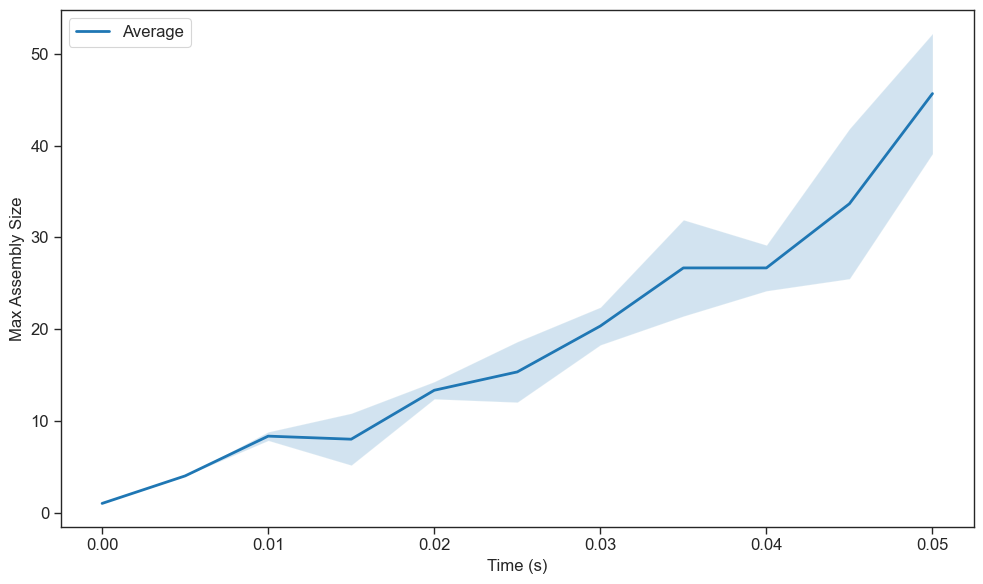
Plot saved to /Users/sikao/Documents/GitHub/ionerdss/data/8y7s_dir/nerdss_output/figure_plot_data/max_assembly_size_vs_time.svg
[4]:
analysis.plot_figure(figure_type='line',
                     x='time',
                     y='maximum_assembly',
                     legend=['A',],
                     show_type='both')
No simulations specified. Using all available simulations.
Plotting line with:
- x-axis: time
- y-axis: maximum_assembly
- z-axis: None
- Simulations: 3 selected
- Legend: ['A']
- Display mode: both
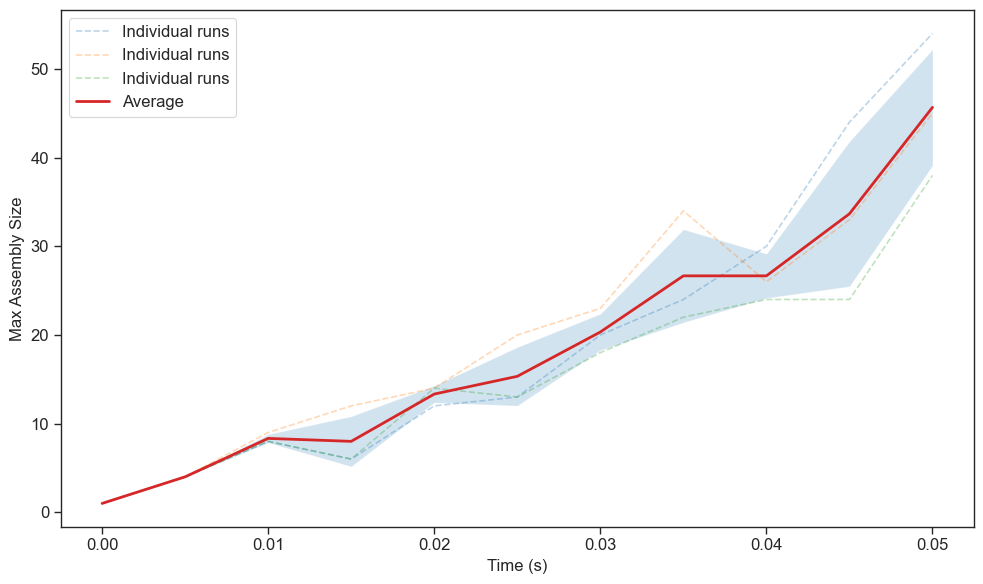
Plot saved to /Users/sikao/Documents/GitHub/ionerdss/data/8y7s_dir/nerdss_output/figure_plot_data/max_assembly_size_vs_time.svg
[6]:
analysis.plot_figure(figure_type='line',
                     x='time',
                     y='average_assembly',
                     legend=['A>=2'],
                     show_type='average')
No simulations specified. Using all available simulations.
Plotting line with:
- x-axis: time
- y-axis: average_assembly
- z-axis: None
- Simulations: 3 selected
- Legend: ['A>=2']
- Display mode: average
Processed data saved to /Users/sikao/Documents/GitHub/ionerdss/data/8y7s_dir/nerdss_output/figure_plot_data/average_assembly_size_vs_time.csv
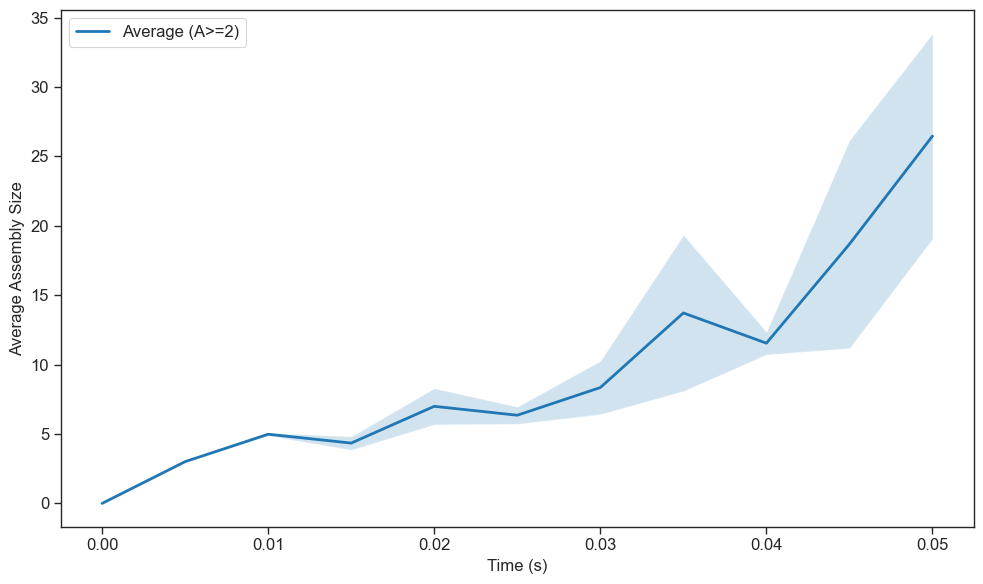
Plot saved to /Users/sikao/Documents/GitHub/ionerdss/data/8y7s_dir/nerdss_output/figure_plot_data/average_assembly_size_vs_time.svg
[3]:
analysis.plot_figure(figure_type='line',
                     x='time',
                     y='fraction_of_monomers_assembled',
                     legend=['A>=4'],
                     show_type='average')
No simulations specified. Using all available simulations.
Plotting line with:
- x-axis: time
- y-axis: fraction_of_monomers_assembled
- z-axis: None
- Simulations: 3 selected
- Legend: ['A>=4']
- Display mode: average
Processed data saved to /Users/sikao/Documents/GitHub/ionerdss/data/8y7s_dir/nerdss_output/figure_plot_data/fraction_of_monomers_assembled_vs_time.csv
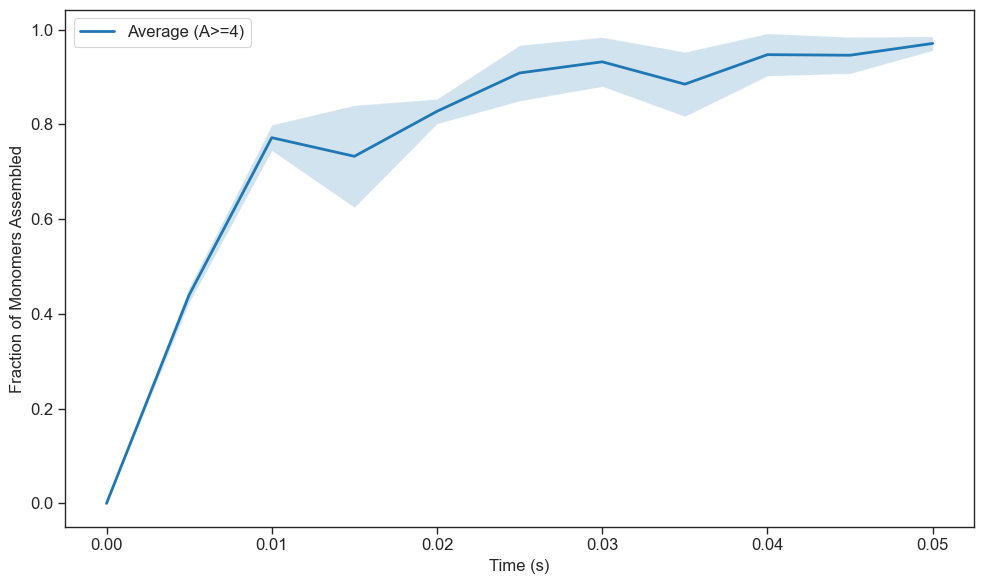
Plot saved to /Users/sikao/Documents/GitHub/ionerdss/data/8y7s_dir/nerdss_output/figure_plot_data/fraction_of_monomers_assembled_vs_time.svg
[7]:
analysis.plot_figure(figure_type='hist', x='size', y='complex_count', legend=['A'], bins=10, frequency=False, normalize=False)
No simulations specified. Using all available simulations.
Plotting hist with:
- x-axis: size
- y-axis: complex_count
- z-axis: None
- Simulations: 3 selected
- Legend: ['A']
- Display mode: both
Bin edges: [ 1.   2.3  3.6  4.9  6.2  7.5  8.8 10.1 11.4 12.7 14. ]
Bin centers: [ 1.65  2.95  4.25  5.55  6.85  8.15  9.45 10.75 12.05 13.35]
Processed data saved to /Users/sikao/Documents/GitHub/ionerdss/data/8y7s_dir/nerdss_output/figure_plot_data/hist_average_number_vs_size.csv

Plot saved to /Users/sikao/Documents/GitHub/ionerdss/data/8y7s_dir/nerdss_output/figure_plot_data/hist_average_number_vs_size.svg
[13]:
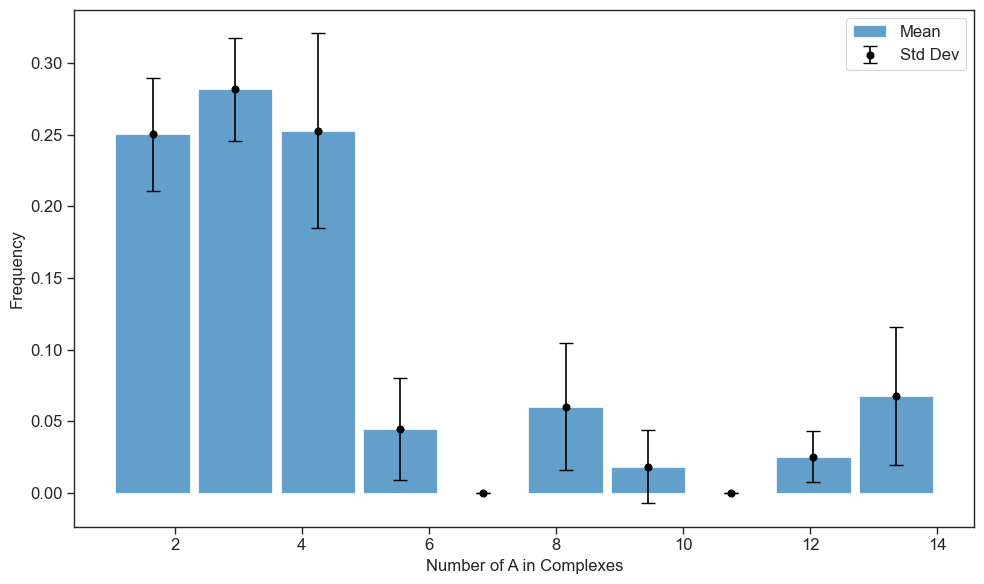
analysis.plot_figure(figure_type='hist', x='size', y='monomer_count', legend=['A'], bins=10, frequency=True, normalize=True)
No simulations specified. Using all available simulations.
Plotting hist with:
- x-axis: size
- y-axis: monomer_count
- z-axis: None
- Simulations: 3 selected
- Legend: ['A']
- Display mode: both
Processed data saved to /Users/sikao/Documents/GitHub/ionerdss/data/8y7s_dir/nerdss_output/figure_plot_data/hist_monomer_count_vs_size.csv
Plot saved to /Users/sikao/Documents/GitHub/ionerdss/data/8y7s_dir/nerdss_output/figure_plot_data/hist_monomer_count_vs_size.svg
[4]:
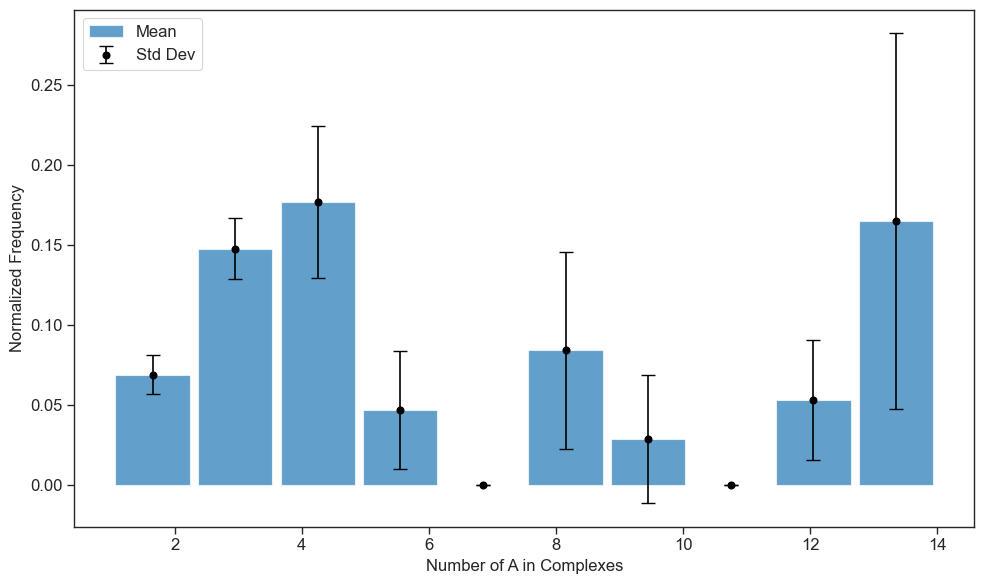
analysis.plot_figure(figure_type='hist', x='size', y='complex_count', legend=['A'], bins=10, frequency=True, normalize=False)
No simulations specified. Using all available simulations.
Plotting hist with:
- x-axis: size
- y-axis: complex_count
- z-axis: None
- Simulations: 3 selected
- Legend: ['A']
- Display mode: both
Bin edges: [ 1.   2.3  3.6  4.9  6.2  7.5  8.8 10.1 11.4 12.7 14. ]
Bin centers: [ 1.65  2.95  4.25  5.55  6.85  8.15  9.45 10.75 12.05 13.35]
Processed data saved to /Users/sikao/Documents/GitHub/ionerdss/data/8y7s_dir/nerdss_output/figure_plot_data/hist_average_number_vs_size.csv
Plot saved to /Users/sikao/Documents/GitHub/ionerdss/data/8y7s_dir/nerdss_output/figure_plot_data/hist_average_number_vs_size.svg
[5]:
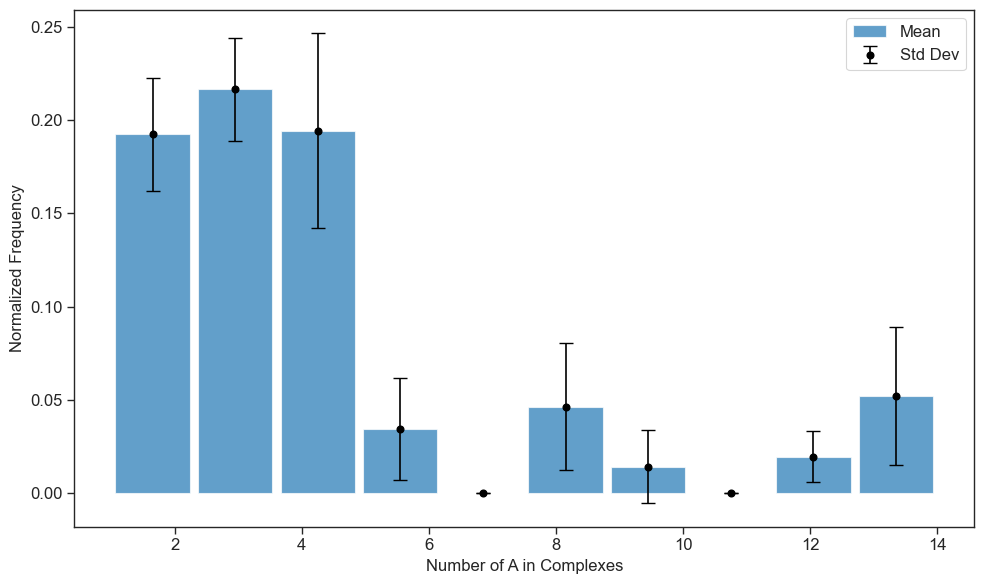
analysis.plot_figure(figure_type='hist', x='size', y='complex_count', legend=['A'], bins=10, frequency=True, normalize=True)
No simulations specified. Using all available simulations.
Plotting hist with:
- x-axis: size
- y-axis: complex_count
- z-axis: None
- Simulations: 3 selected
- Legend: ['A']
- Display mode: both
Bin edges: [ 1.   2.3  3.6  4.9  6.2  7.5  8.8 10.1 11.4 12.7 14. ]
Bin centers: [ 1.65  2.95  4.25  5.55  6.85  8.15  9.45 10.75 12.05 13.35]
Processed data saved to /Users/sikao/Documents/GitHub/ionerdss/data/8y7s_dir/nerdss_output/figure_plot_data/hist_average_number_vs_size.csv
Plot saved to /Users/sikao/Documents/GitHub/ionerdss/data/8y7s_dir/nerdss_output/figure_plot_data/hist_average_number_vs_size.svg
[3]:
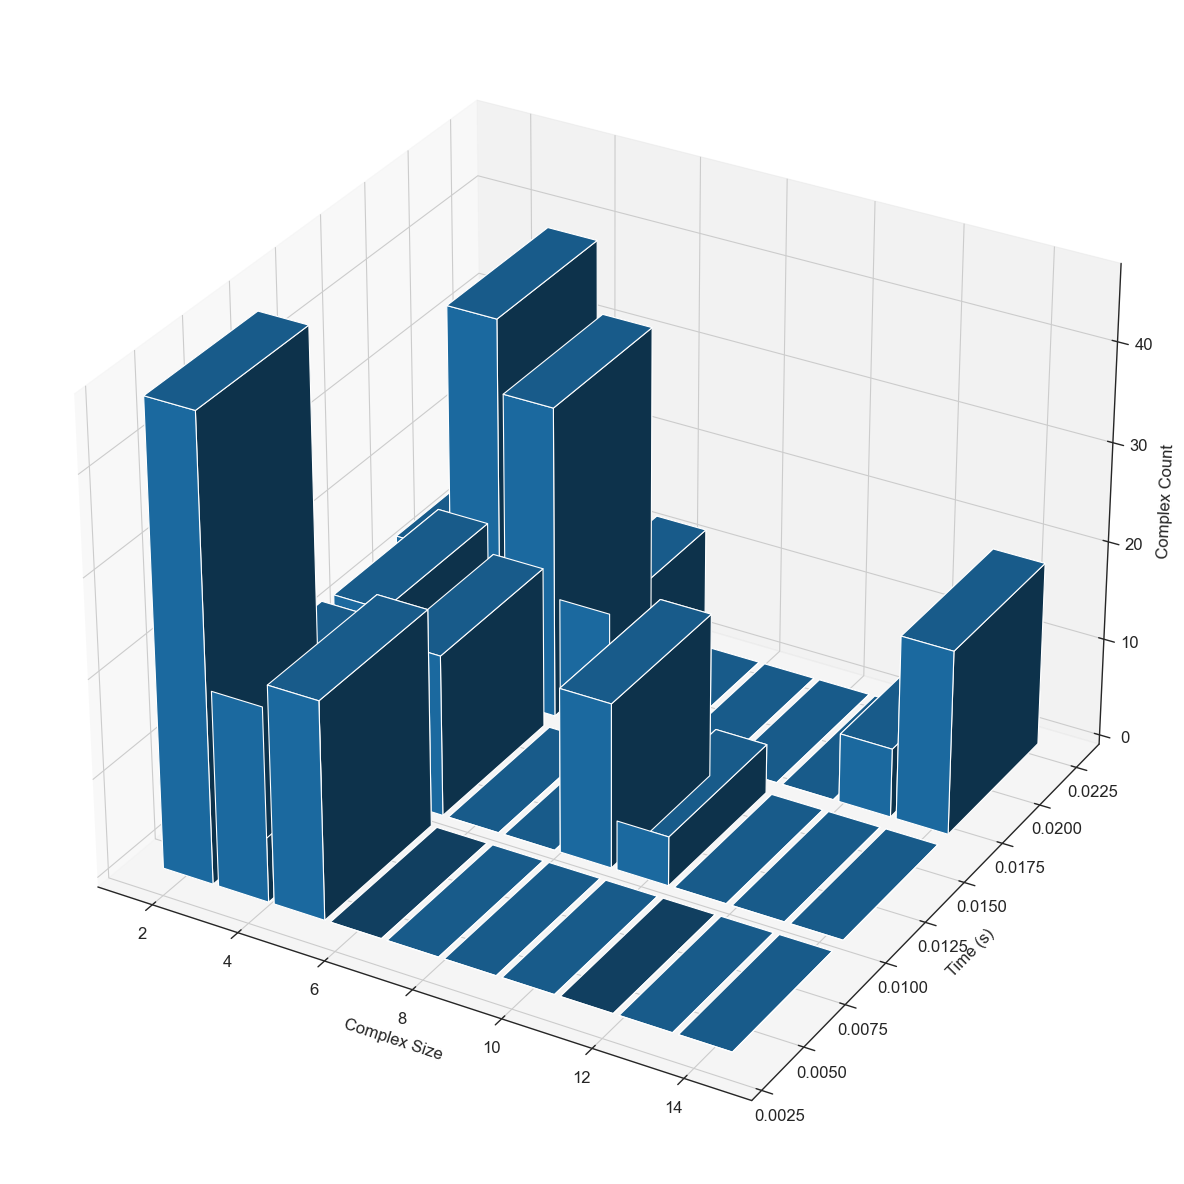
analysis.plot_figure(figure_type='3dhist', x='size', y='time', z='complex_count', legend=['A'], bins=10, time_bins=5, frequency=False, normalize=False, figure_size=(12, 12))
No simulations specified. Using all available simulations.
Plotting 3dhist with:
- x-axis: size
- y-axis: time
- z-axis: complex_count
- Simulations: 3 selected
- Legend: ['A']
- Display mode: both
Time edges: [0.    0.004 0.008 0.012 0.016 0.02 ]
Time centers: [0.002 0.006 0.01  0.014 0.018]
Size edges: [ 1.   2.3  3.6  4.9  6.2  7.5  8.8 10.1 11.4 12.7 14. ]
Size centers: [ 1.65  2.95  4.25  5.55  6.85  8.15  9.45 10.75 12.05 13.35]
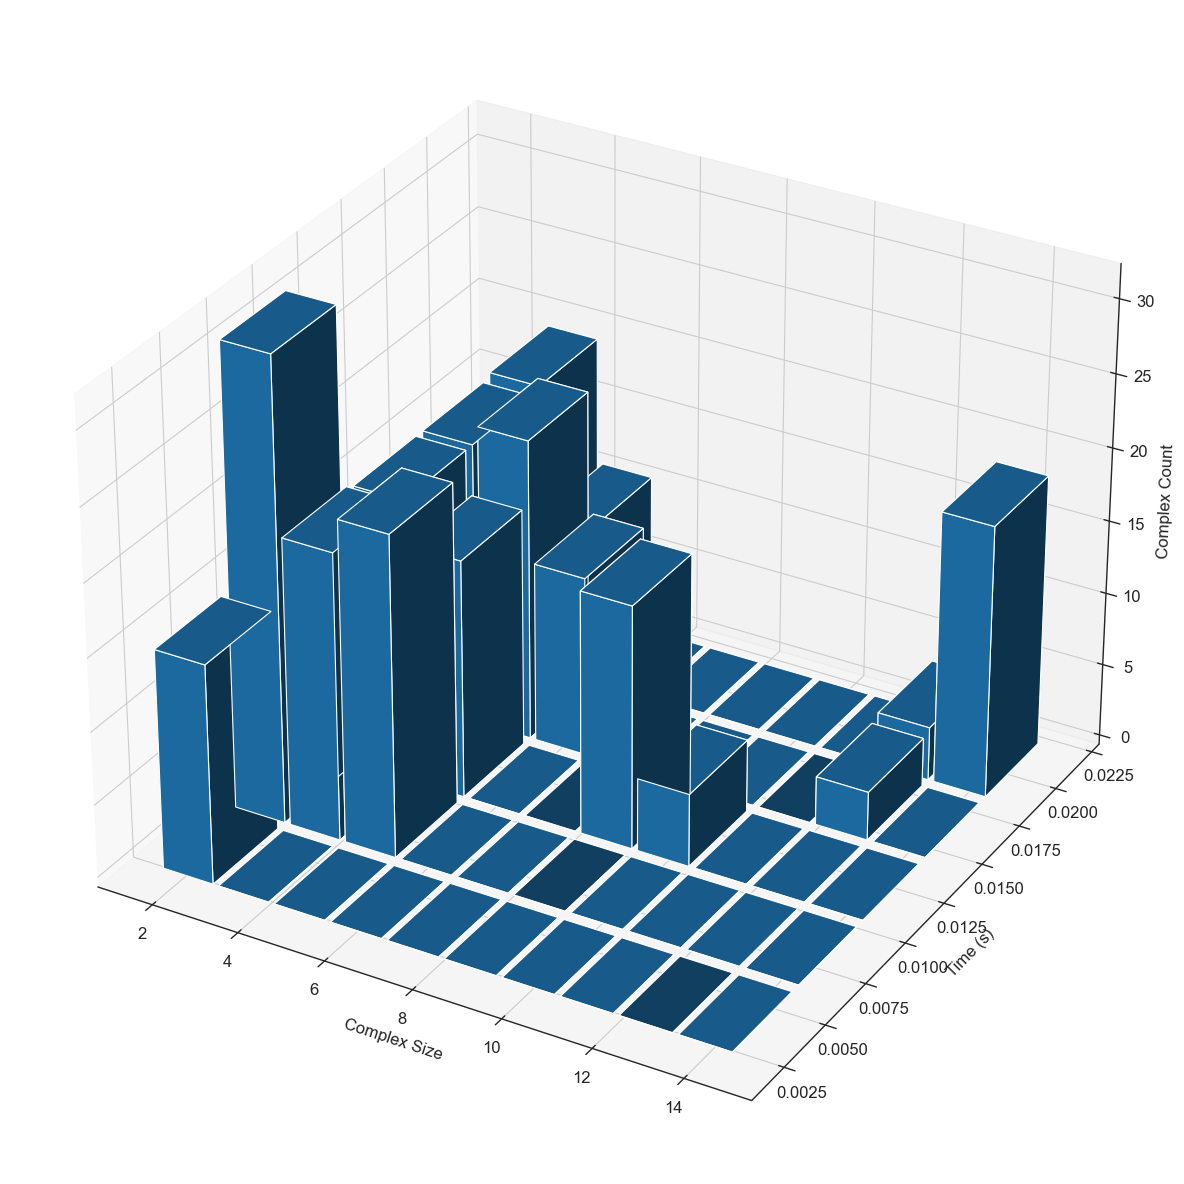
3D plot saved to /Users/sikao/Documents/GitHub/ionerdss/data/8y7s_dir/nerdss_output/figure_plot_data/3D_hist_complex_species.svg
Histogram data saved to /Users/sikao/Documents/GitHub/ionerdss/data/8y7s_dir/nerdss_output/figure_plot_data/hist_complex_species_size_3d.csv
[4]:
analysis.plot_figure(figure_type='heatmap', x='size', y='time', z='complex_count', legend=['A'], bins=10, time_bins=5, frequency=False, normalize=False, figure_size=(8, 6))
No simulations specified. Using all available simulations.
Plotting heatmap with:
- x-axis: size
- y-axis: time
- z-axis: complex_count
- Simulations: 3 selected
- Legend: ['A']
- Display mode: both
Heatmap data saved to /Users/sikao/Documents/GitHub/ionerdss/data/8y7s_dir/nerdss_output/figure_plot_data/heatmap_complex_species_size.csv
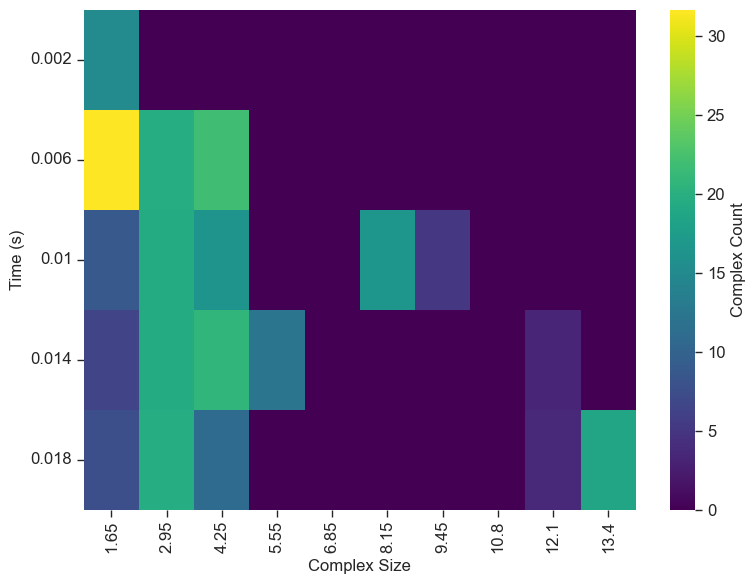
Heatmap plot saved to /Users/sikao/Documents/GitHub/ionerdss/data/8y7s_dir/nerdss_output/figure_plot_data/heatmap_complex_species_size.svg
[4]:
analysis.plot_figure(figure_type='3dhist', x='size', y='time', z='complex_count', legend=['A'], bins=10, time_bins=5, frequency=True, normalize=False, figure_size=(12, 12))
No simulations specified. Using all available simulations.
Plotting 3dhist with:
- x-axis: size
- y-axis: time
- z-axis: complex_count
- Simulations: 3 selected
- Legend: ['A']
- Display mode: both
Time edges: [0.    0.004 0.008 0.012 0.016 0.02 ]
Time centers: [0.002 0.006 0.01  0.014 0.018]
Size edges: [ 1.   2.3  3.6  4.9  6.2  7.5  8.8 10.1 11.4 12.7 14. ]
Size centers: [ 1.65  2.95  4.25  5.55  6.85  8.15  9.45 10.75 12.05 13.35]
3D plot saved to /Users/sikao/Documents/GitHub/ionerdss/data/8y7s_dir/nerdss_output/figure_plot_data/3D_hist_complex_species.svg
Histogram data saved to /Users/sikao/Documents/GitHub/ionerdss/data/8y7s_dir/nerdss_output/figure_plot_data/hist_complex_species_size_3d.csv
[5]:
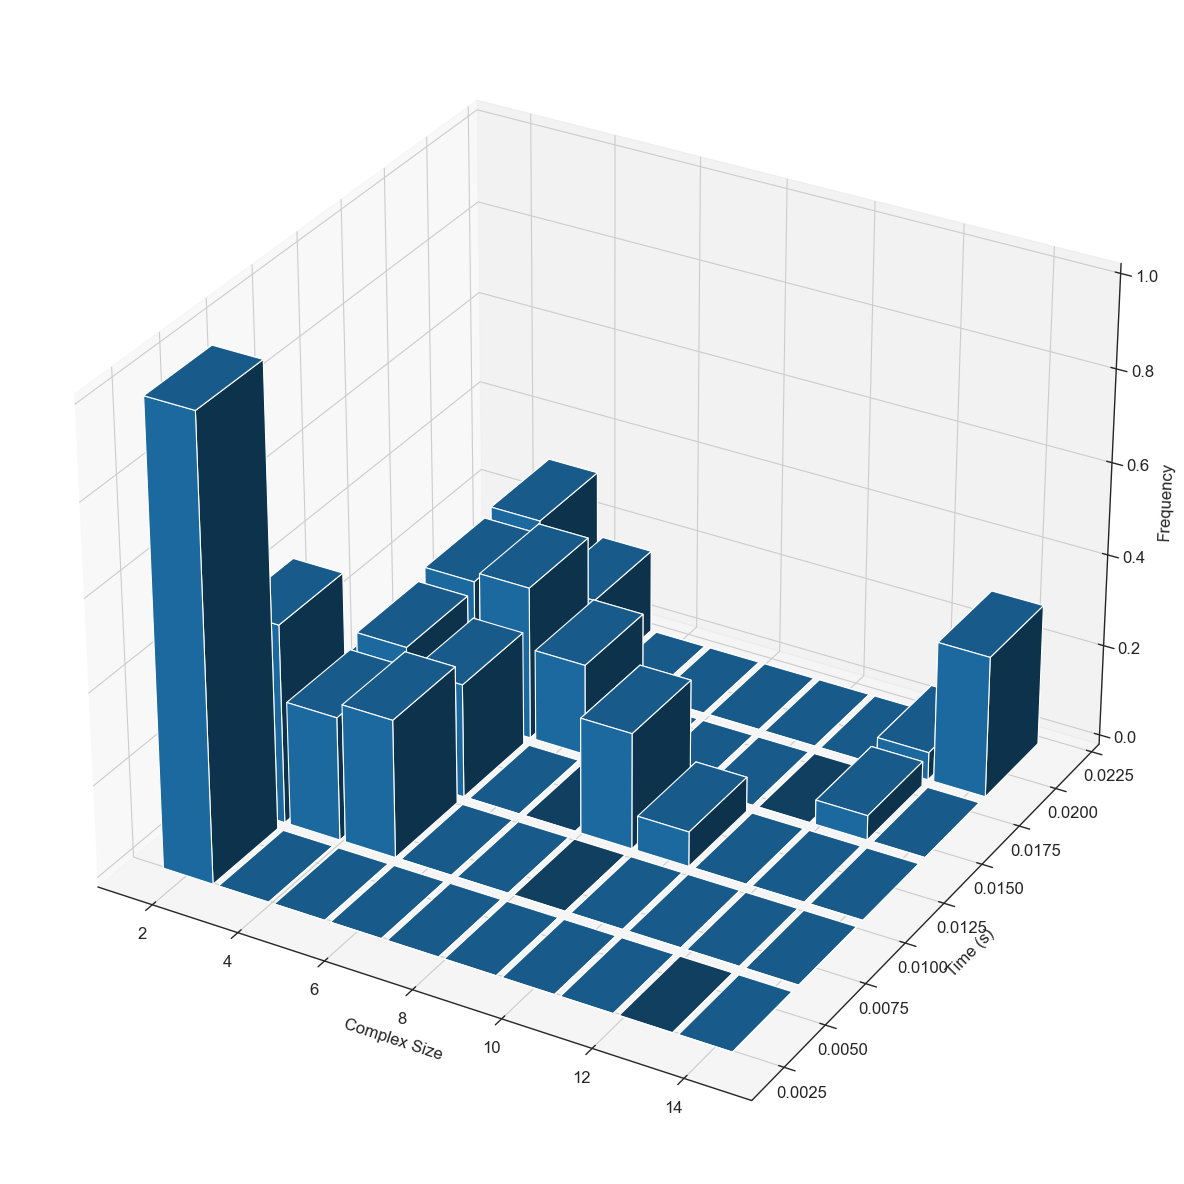
analysis.plot_figure(figure_type='3dhist', x='size', y='time', z='complex_count', legend=['A'], bins=10, time_bins=5, frequency=True, normalize=True, figure_size=(12, 12))
No simulations specified. Using all available simulations.
Plotting 3dhist with:
- x-axis: size
- y-axis: time
- z-axis: complex_count
- Simulations: 3 selected
- Legend: ['A']
- Display mode: both
Time edges: [0.    0.004 0.008 0.012 0.016 0.02 ]
Time centers: [0.002 0.006 0.01  0.014 0.018]
Size edges: [ 1.   2.3  3.6  4.9  6.2  7.5  8.8 10.1 11.4 12.7 14. ]
Size centers: [ 1.65  2.95  4.25  5.55  6.85  8.15  9.45 10.75 12.05 13.35]

3D plot saved to /Users/sikao/Documents/GitHub/ionerdss/data/8y7s_dir/nerdss_output/figure_plot_data/3D_hist_complex_species.svg
Histogram data saved to /Users/sikao/Documents/GitHub/ionerdss/data/8y7s_dir/nerdss_output/figure_plot_data/hist_complex_species_size_3d.csv
[6]:
analysis.plot_figure(figure_type='3dhist', x='size', y='time', z='complex_count', legend=['A'], bins=10, time_bins=3, frequency=False, normalize=False, figure_size=(12, 12))
No simulations specified. Using all available simulations.
Plotting 3dhist with:
- x-axis: size
- y-axis: time
- z-axis: complex_count
- Simulations: 3 selected
- Legend: ['A']
- Display mode: both
Time edges: [0.         0.00666667 0.01333333 0.02      ]
Time centers: [0.00333333 0.01       0.01666667]
Size edges: [ 1.   2.3  3.6  4.9  6.2  7.5  8.8 10.1 11.4 12.7 14. ]
Size centers: [ 1.65  2.95  4.25  5.55  6.85  8.15  9.45 10.75 12.05 13.35]
3D plot saved to /Users/sikao/Documents/GitHub/ionerdss/data/8y7s_dir/nerdss_output/figure_plot_data/3D_hist_complex_species.svg
Histogram data saved to /Users/sikao/Documents/GitHub/ionerdss/data/8y7s_dir/nerdss_output/figure_plot_data/hist_complex_species_size_3d.csv
[3]:
analysis.plot_figure(figure_type='3dhist', x='size', y='time', z='monomer_count', legend=['A'], bins=10, time_bins=5, frequency=False, normalize=False, figure_size=(12, 12))
No simulations specified. Using all available simulations.
Plotting 3dhist with:
- x-axis: size
- y-axis: time
- z-axis: monomer_count
- Simulations: 3 selected
- Legend: ['A']
- Display mode: both
Time edges: [0.    0.004 0.008 0.012 0.016 0.02 ]
Time centers: [0.002 0.006 0.01  0.014 0.018]
Size edges: [ 1.   2.3  3.6  4.9  6.2  7.5  8.8 10.1 11.4 12.7 14. ]
Size centers: [ 1.65  2.95  4.25  5.55  6.85  8.15  9.45 10.75 12.05 13.35]
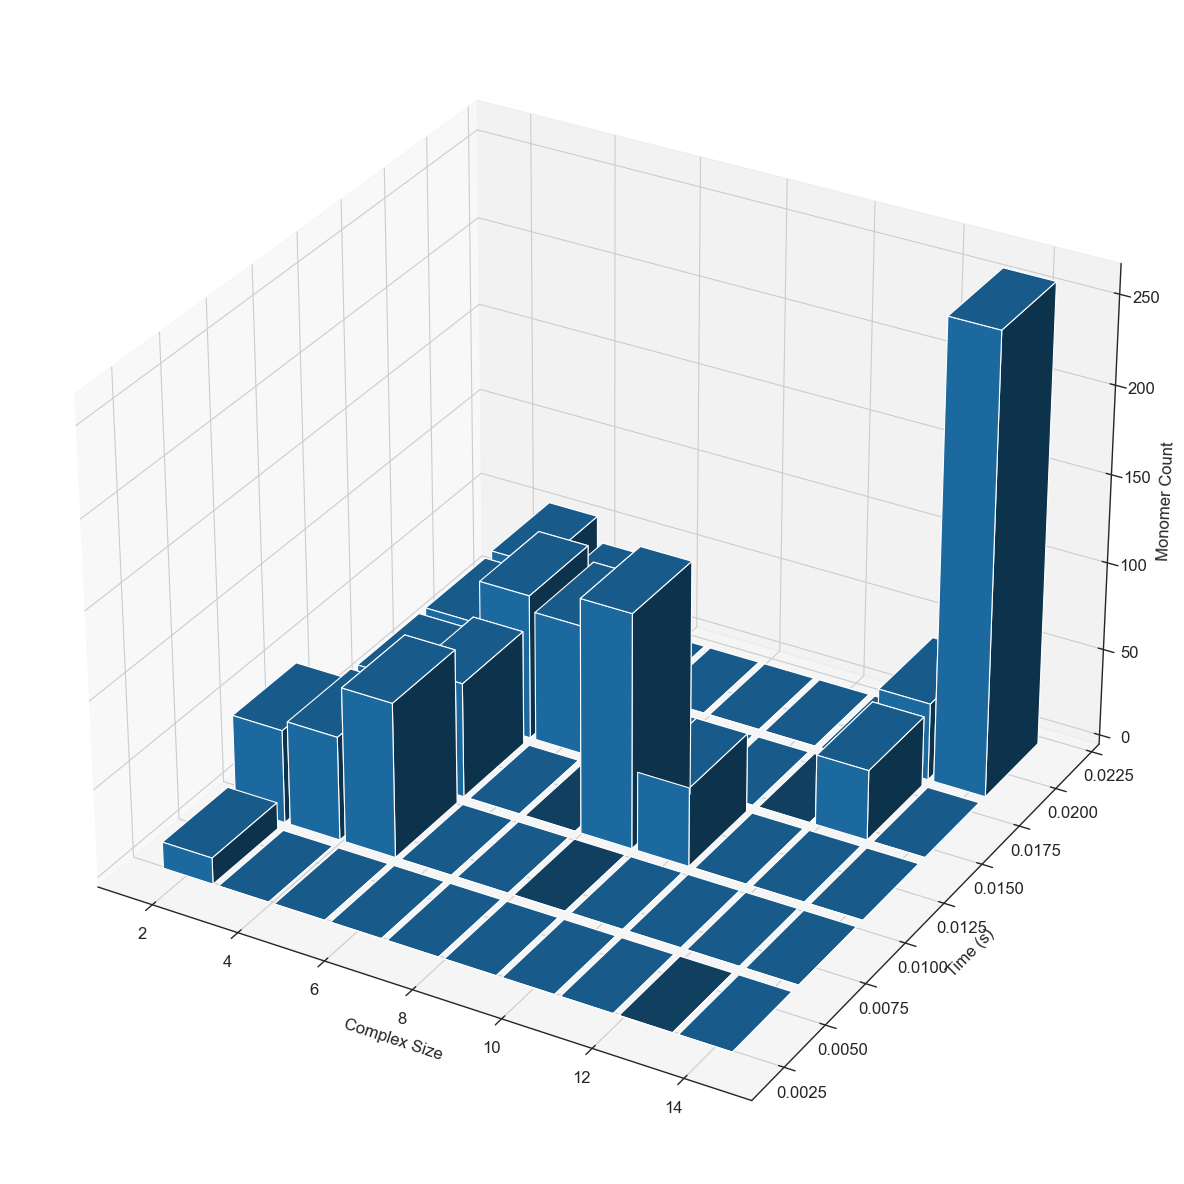
3D plot saved to /Users/sikao/Documents/GitHub/ionerdss/data/8y7s_dir/nerdss_output/figure_plot_data/3D_hist_monomer_species.svg
Histogram data saved to /Users/sikao/Documents/GitHub/ionerdss/data/8y7s_dir/nerdss_output/figure_plot_data/hist_monomer_count_vs_size_3d.csv
[4]:
analysis.plot_figure(figure_type='heatmap', x='size', y='time', z='monomer_count', legend=['A'], bins=10, time_bins=5, frequency=False, normalize=False, figure_size=(8, 6))
No simulations specified. Using all available simulations.
Plotting heatmap with:
- x-axis: size
- y-axis: time
- z-axis: monomer_count
- Simulations: 3 selected
- Legend: ['A']
- Display mode: both
Heatmap data saved to /Users/sikao/Documents/GitHub/ionerdss/data/8y7s_dir/nerdss_output/figure_plot_data/heatmap_monomer_counts_vs_complex_size.csv
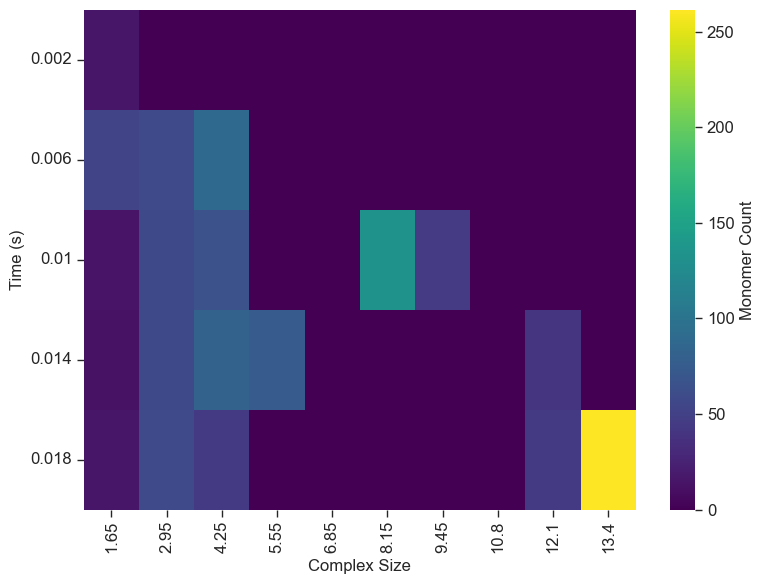
Heatmap plot saved to /Users/sikao/Documents/GitHub/ionerdss/data/8y7s_dir/nerdss_output/figure_plot_data/heatmap_monomer_counts_vs_complex_size.svg
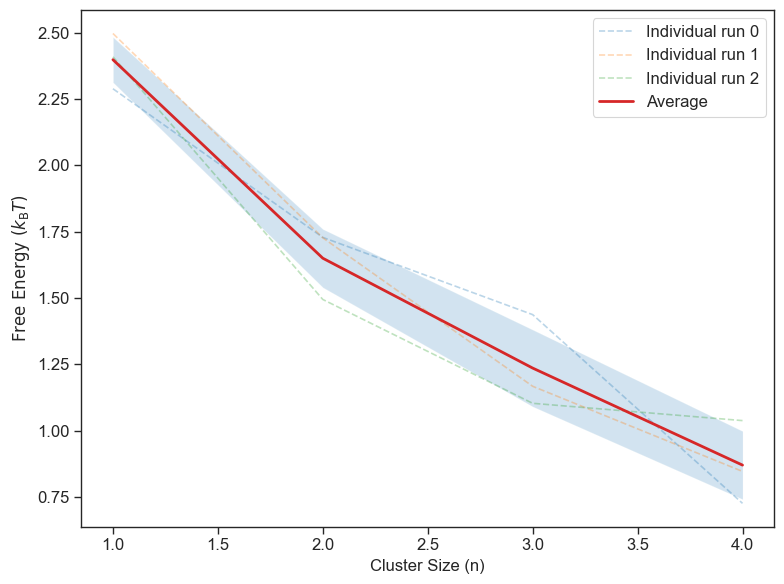
[3]:
analysis.plot_figure(figure_type='line', x='size', y='free_energy', legend=['A'], figure_size=(8, 6))
No simulations specified. Using all available simulations.
Plotting line with:
- x-axis: size
- y-axis: free_energy
- z-axis: None
- Simulations: 3 selected
- Legend: ['A']
- Display mode: both
Processed data saved to /Users/sikao/Documents/GitHub/ionerdss/data/8y7s_dir/nerdss_output/figure_plot_data/free_energy_vs_size.csv
/Users/sikao/Documents/GitHub/ionerdss/ionerdss/nerdss_analysis/plot_figures.py:1701: RuntimeWarning: Mean of empty slice
  avg_free_energy = np.nanmean(free_energy_array, axis=0)
/Users/sikao/anaconda3/envs/local_nerdss/lib/python3.9/site-packages/numpy/lib/_nanfunctions_impl.py:2035: RuntimeWarning: Degrees of freedom <= 0 for slice.
  var = nanvar(a, axis=axis, dtype=dtype, out=out, ddof=ddof,
Plot saved to /Users/sikao/Documents/GitHub/ionerdss/data/8y7s_dir/nerdss_output/figure_plot_data/free_energy_vs_size.svg
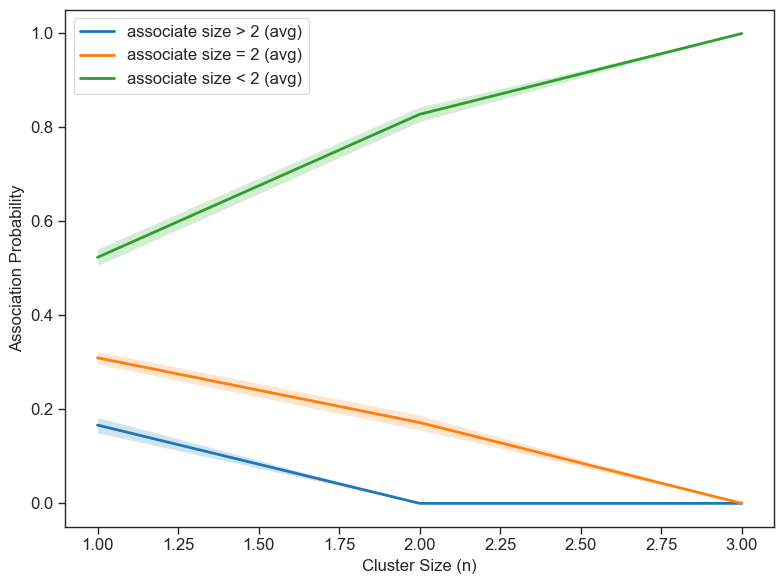
[3]:
analysis.plot_figure(figure_type='line', x='size', y='symmetric_association_probability', legend=["associate size > 2", "associate size = 2", "associate size < 2"], show_type='average', figure_size=(8, 6))
No simulations specified. Using all available simulations.
Plotting line with:
- x-axis: size
- y-axis: symmetric_association_probability
- z-axis: None
- Simulations: 3 selected
- Legend: ['associate size > 2', 'associate size = 2', 'associate size < 2']
- Display mode: average
Processed data saved to /Users/sikao/Documents/GitHub/ionerdss/data/8y7s_dir/nerdss_output/figure_plot_data/symmetric_association_probability.csv
/Users/sikao/Documents/GitHub/ionerdss/ionerdss/nerdss_analysis/plot_figures.py:1679: RuntimeWarning: Mean of empty slice
  avg_probs = np.nanmean(prob_array, axis=0)
/Users/sikao/anaconda3/envs/local_nerdss/lib/python3.9/site-packages/numpy/lib/_nanfunctions_impl.py:2035: RuntimeWarning: Degrees of freedom <= 0 for slice.
  var = nanvar(a, axis=axis, dtype=dtype, out=out, ddof=ddof,
Plot saved to /Users/sikao/Documents/GitHub/ionerdss/data/8y7s_dir/nerdss_output/figure_plot_data/symmetric_association_probability.svg
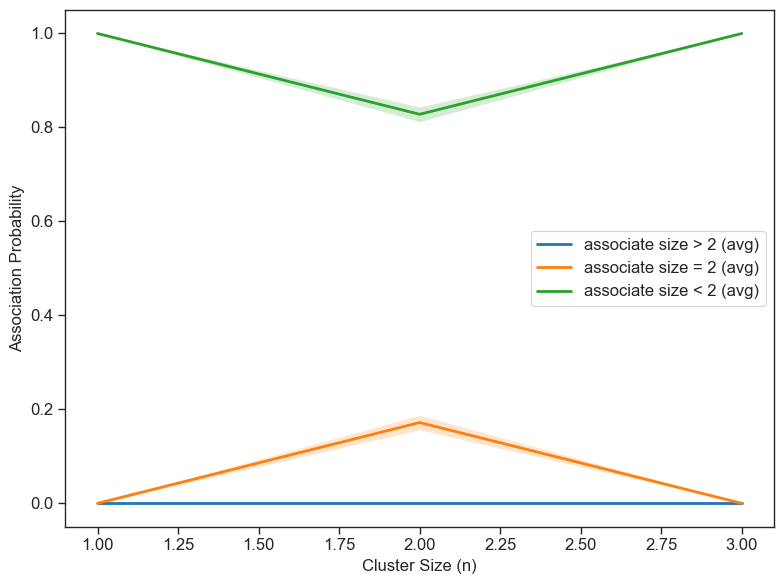
[3]:
analysis.plot_figure(figure_type='line', x='size', y='asymmetric_association_probability', legend=["associate size > 2", "associate size = 2", "associate size < 2"], show_type='average', figure_size=(8, 6))
No simulations specified. Using all available simulations.
Plotting line with:
- x-axis: size
- y-axis: asymmetric_association_probability
- z-axis: None
- Simulations: 3 selected
- Legend: ['associate size > 2', 'associate size = 2', 'associate size < 2']
- Display mode: average
Processed data saved to /Users/sikao/Documents/GitHub/ionerdss/data/8y7s_dir/nerdss_output/figure_plot_data/asymmetric_association_probability.csv
/Users/sikao/Documents/GitHub/ionerdss/ionerdss/nerdss_analysis/plot_figures.py:1798: RuntimeWarning: Mean of empty slice
  avg_probs = np.nanmean(prob_array, axis=0)
/Users/sikao/anaconda3/envs/local_nerdss/lib/python3.9/site-packages/numpy/lib/_nanfunctions_impl.py:2035: RuntimeWarning: Degrees of freedom <= 0 for slice.
  var = nanvar(a, axis=axis, dtype=dtype, out=out, ddof=ddof,
Plot saved to /Users/sikao/Documents/GitHub/ionerdss/data/8y7s_dir/nerdss_output/figure_plot_data/asymmetric_association_probability.svg
[ ]:
# following lines are commented out because this test dataset does not have enough dissociation events
# analysis.plot_figure(figure_type='line', x='size', y='symmetric_dissociation_probability', legend=["dissociate size > 2", "dissociate size = 2", "dissociate size < 2"], show_type='average', figure_size=(8, 6))
# analysis.plot_figure(figure_type='line', x='size', y='asymmetric_dissociation_probability', legend=["dissociate size > 2", "dissociate size = 2", "dissociate size < 2"], show_type='average', figure_size=(8, 6))
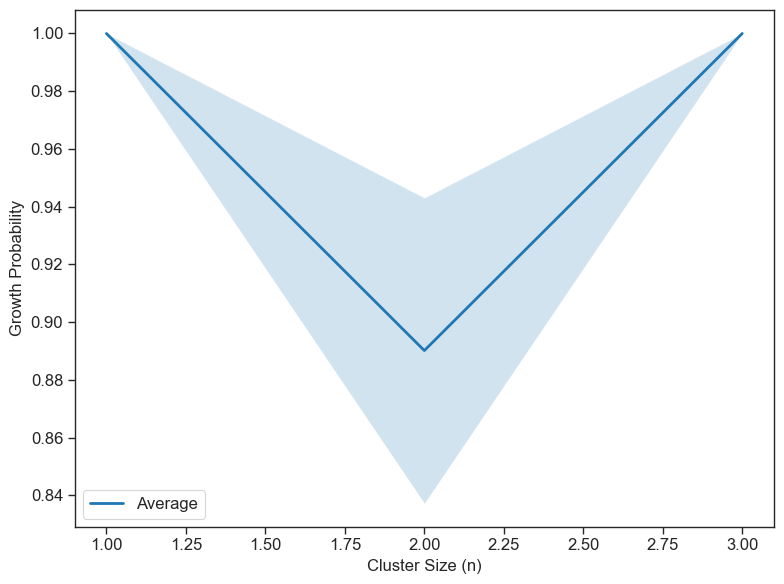
[3]:
analysis.plot_figure(figure_type='line', x='size', y='growth_probability', legend=["A"], show_type='average', figure_size=(8, 6))
No simulations specified. Using all available simulations.
Plotting line with:
- x-axis: size
- y-axis: growth_probability
- z-axis: None
- Simulations: 3 selected
- Legend: ['A']
- Display mode: average
Processed data saved to /Users/sikao/Documents/GitHub/ionerdss/data/8y7s_dir/nerdss_output/figure_plot_data/growth_probability.csv
/Users/sikao/Documents/GitHub/ionerdss/ionerdss/nerdss_analysis/plot_figures.py:2147: RuntimeWarning: Mean of empty slice
  avg_probs = np.nanmean(prob_array, axis=0)
/Users/sikao/anaconda3/envs/local_nerdss/lib/python3.9/site-packages/numpy/lib/_nanfunctions_impl.py:2035: RuntimeWarning: Degrees of freedom <= 0 for slice.
  var = nanvar(a, axis=axis, dtype=dtype, out=out, ddof=ddof,
Plot saved to /Users/sikao/Documents/GitHub/ionerdss/data/8y7s_dir/nerdss_output/figure_plot_data/growth_probability.svg
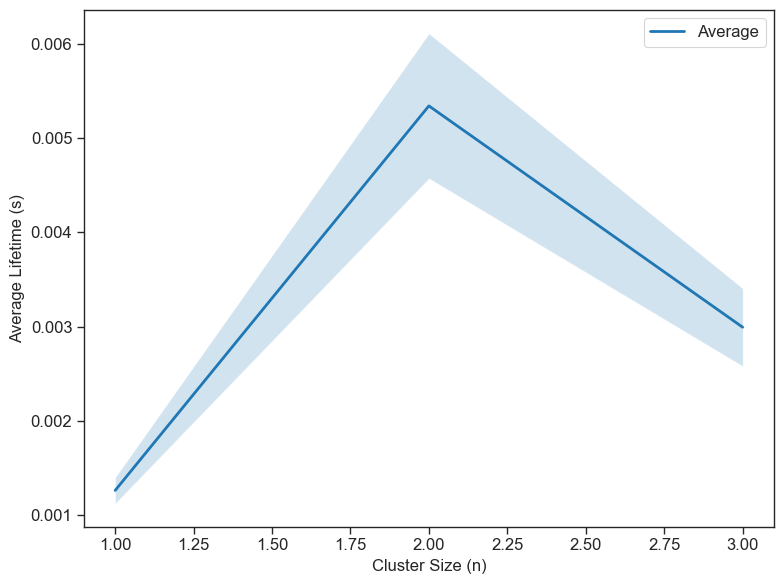
[3]:
analysis.plot_figure(figure_type='line', x='size', y='lifetime', legend=["A"], show_type='average', figure_size=(8, 6))
No simulations specified. Using all available simulations.
Plotting line with:
- x-axis: size
- y-axis: lifetime
- z-axis: None
- Simulations: 3 selected
- Legend: ['A']
- Display mode: average
Processed data saved to /Users/sikao/Documents/GitHub/ionerdss/data/8y7s_dir/nerdss_output/figure_plot_data/lifetime_vs_size.csv
Plot saved to /Users/sikao/Documents/GitHub/ionerdss/data/8y7s_dir/nerdss_output/figure_plot_data/lifetime_vs_size.svg
[2]:
analysis_8erq = ion.Analyzer("./data/8erq_dir/nerdss_output/")
Detected a batch of 3 simulation directories.
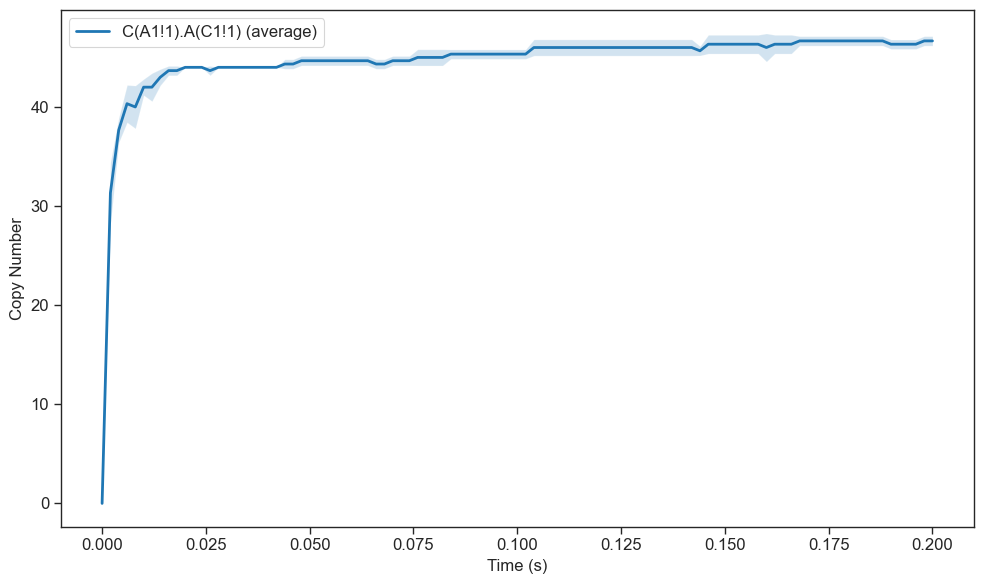
[11]:
analysis_8erq.plot_figure(figure_type='line',
                     x='time',
                     y='species',
                     legend=[['C(A1!1).A(C1!1)'],],
                     show_type='average')
No simulations specified. Using all available simulations.
Plotting line with:
- x-axis: time
- y-axis: species
- z-axis: None
- Simulations: 3 selected
- Legend: [['C(A1!1).A(C1!1)']]
- Display mode: average
Processed data for C(A1!1).A(C1!1) saved to /Users/sikao/Documents/GitHub/ionerdss/data/8erq_dir/nerdss_output/figure_plot_data/C(A1!1).A(C1!1).csv
Plot saved to /Users/sikao/Documents/GitHub/ionerdss/data/8erq_dir/nerdss_output/figure_plot_data/species_vs_time_plot.svg
Plot saved to /Users/sikao/Documents/GitHub/ionerdss/data/8erq_dir/nerdss_output/figure_plot_data/species_vs_time_plot.svg
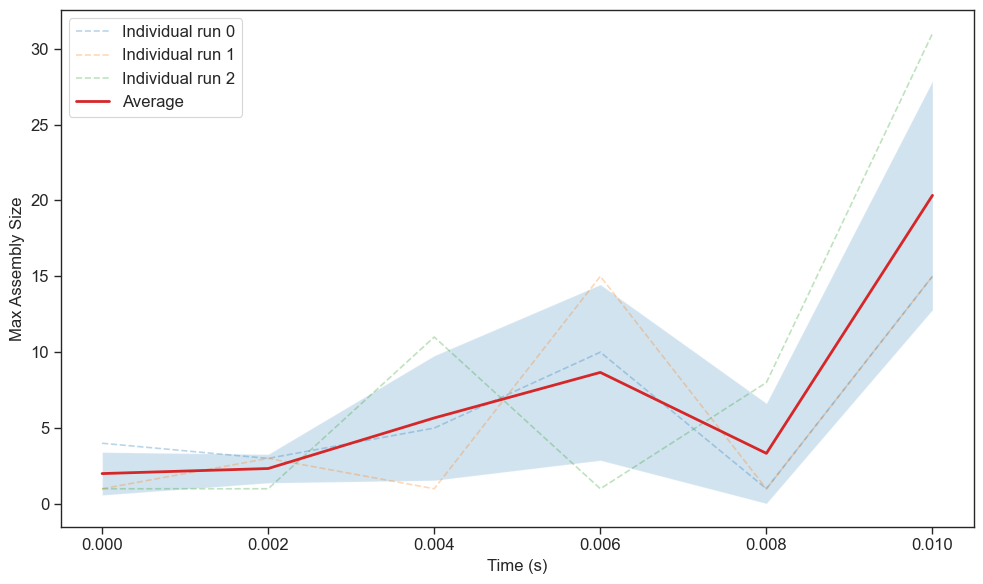
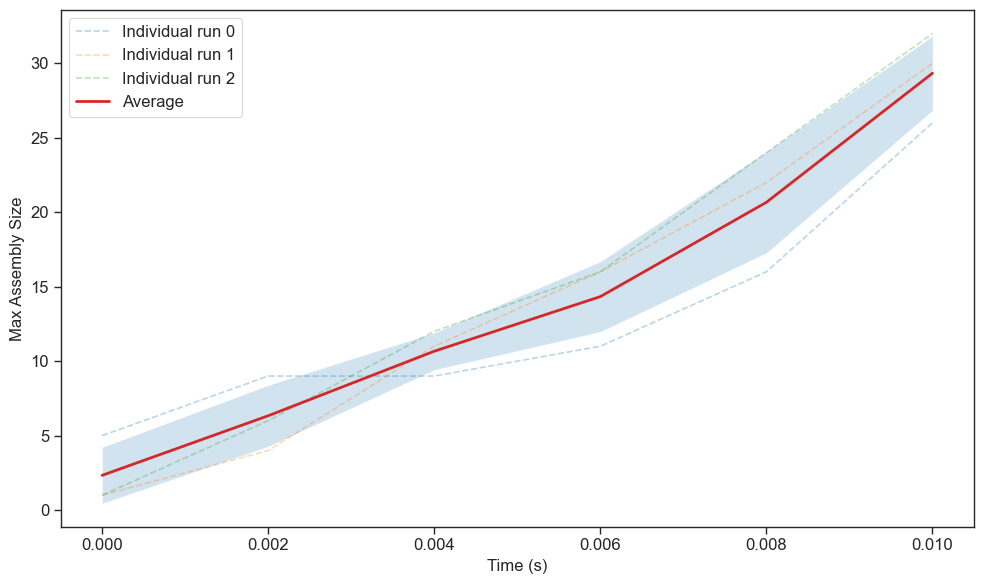
[3]:
analysis_8erq.plot_figure(figure_type='line',
                     x='time',
                     y='maximum_assembly',
                     legend=['A',],
                     show_type='both')
No simulations specified. Using all available simulations.
Plotting line with:
- x-axis: time
- y-axis: maximum_assembly
- z-axis: None
- Simulations: 3 selected
- Legend: ['A']
- Display mode: both
Processed data saved to /Users/sikao/Documents/GitHub/ionerdss/data/8erq_dir/nerdss_output/figure_plot_data/max_assembly_size_vs_time.csv
Plot saved to /Users/sikao/Documents/GitHub/ionerdss/data/8erq_dir/nerdss_output/figure_plot_data/max_assembly_size_vs_time.svg
[4]:
analysis_8erq.plot_figure(figure_type='line',
                     x='time',
                     y='maximum_assembly',
                     legend=['B',],
                     show_type='both')
No simulations specified. Using all available simulations.
Plotting line with:
- x-axis: time
- y-axis: maximum_assembly
- z-axis: None
- Simulations: 3 selected
- Legend: ['B']
- Display mode: both
Processed data saved to /Users/sikao/Documents/GitHub/ionerdss/data/8erq_dir/nerdss_output/figure_plot_data/max_assembly_size_vs_time.csv
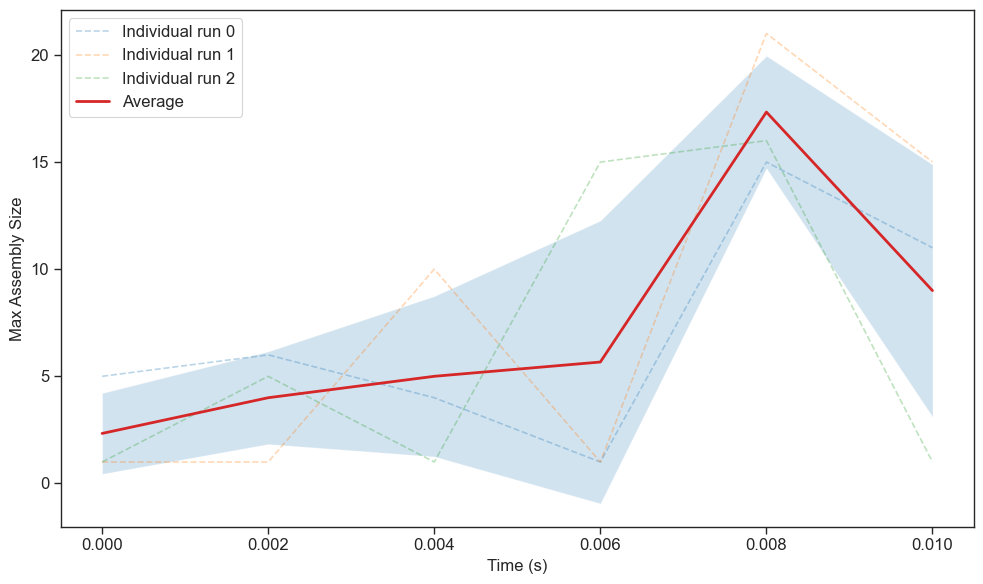
Plot saved to /Users/sikao/Documents/GitHub/ionerdss/data/8erq_dir/nerdss_output/figure_plot_data/max_assembly_size_vs_time.svg
[6]:
analysis_8erq.plot_figure(figure_type='line',
                     x='time',
                     y='maximum_assembly',
                     legend=['A', 'B'],
                     show_type='both')
No simulations specified. Using all available simulations.
Plotting line with:
- x-axis: time
- y-axis: maximum_assembly
- z-axis: None
- Simulations: 3 selected
- Legend: ['A', 'B']
- Display mode: both
Processed data saved to /Users/sikao/Documents/GitHub/ionerdss/data/8erq_dir/nerdss_output/figure_plot_data/max_assembly_size_vs_time.csv
Plot saved to /Users/sikao/Documents/GitHub/ionerdss/data/8erq_dir/nerdss_output/figure_plot_data/max_assembly_size_vs_time.svg
[3]:
analysis_8erq.plot_figure(figure_type='line',
                     x='time',
                     y='average_assembly',
                     legend=['A>=1, B>=2'],
                     show_type='both')
No simulations specified. Using all available simulations.
Plotting line with:
- x-axis: time
- y-axis: average_assembly
- z-axis: None
- Simulations: 3 selected
- Legend: ['A>=1, B>=2']
- Display mode: both
Processed data saved to /Users/sikao/Documents/GitHub/ionerdss/data/8erq_dir/nerdss_output/figure_plot_data/average_assembly_size_vs_time.csv
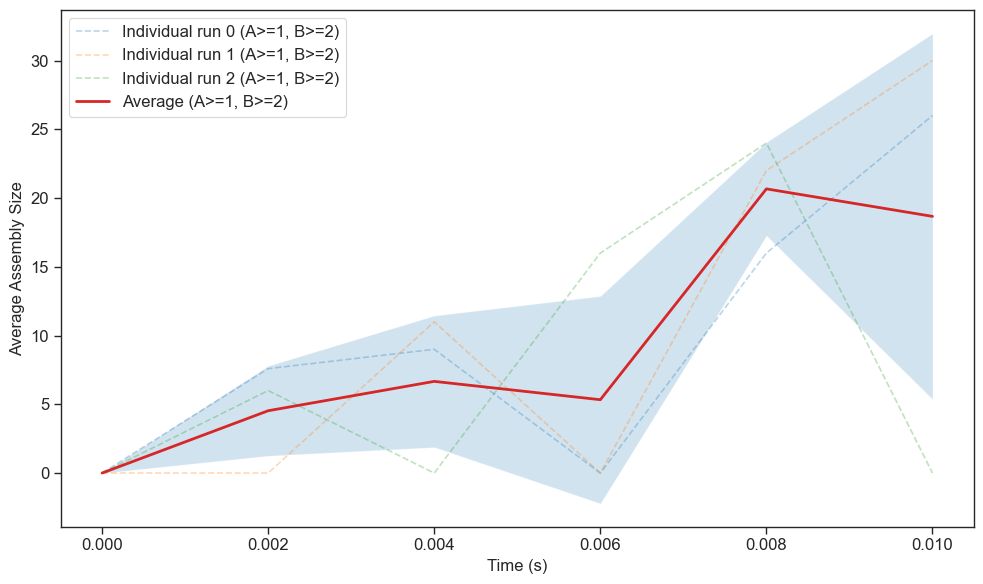
Plot saved to /Users/sikao/Documents/GitHub/ionerdss/data/8erq_dir/nerdss_output/figure_plot_data/average_assembly_size_vs_time.svg
[4]:
analysis_8erq.plot_figure(figure_type='line',
                     x='time',
                     y='average_assembly',
                     legend=['A>=1', 'B>=1'],
                     show_type='average')
No simulations specified. Using all available simulations.
Plotting line with:
- x-axis: time
- y-axis: average_assembly
- z-axis: None
- Simulations: 3 selected
- Legend: ['A>=1', 'B>=1']
- Display mode: average
Processed data saved to /Users/sikao/Documents/GitHub/ionerdss/data/8erq_dir/nerdss_output/figure_plot_data/average_assembly_size_vs_time.csv
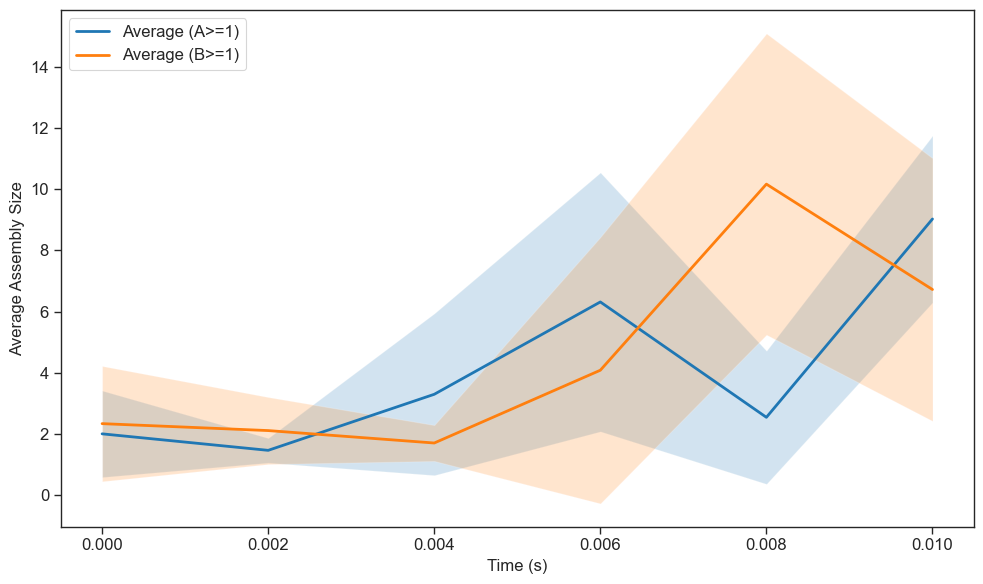
Plot saved to /Users/sikao/Documents/GitHub/ionerdss/data/8erq_dir/nerdss_output/figure_plot_data/average_assembly_size_vs_time.svg
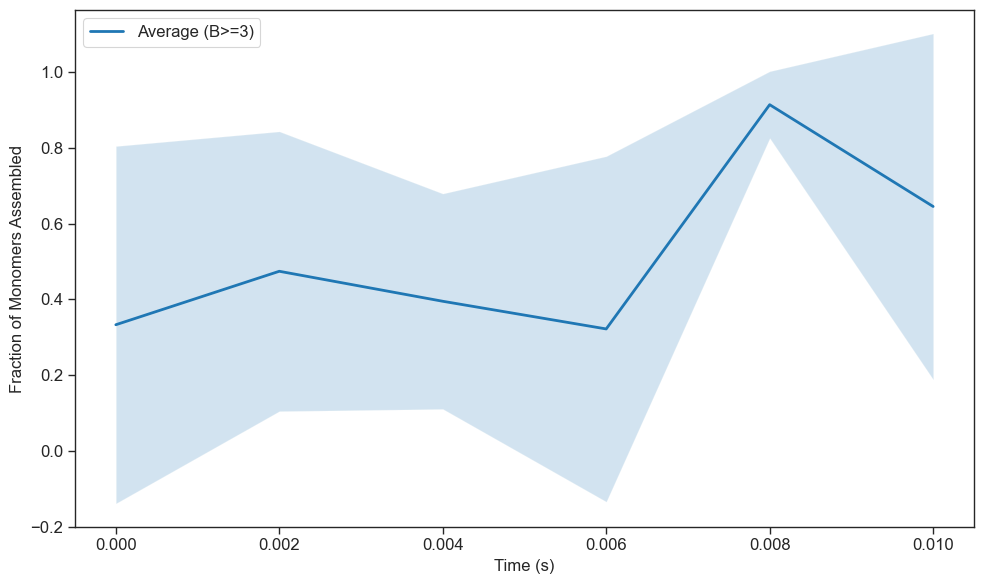
[5]:
analysis_8erq.plot_figure(figure_type='line',
                     x='time',
                     y='fraction_of_monomers_assembled',
                     legend=['B>=3'],
                     show_type='average')
No simulations specified. Using all available simulations.
Plotting line with:
- x-axis: time
- y-axis: fraction_of_monomers_assembled
- z-axis: None
- Simulations: 3 selected
- Legend: ['B>=3']
- Display mode: average
Processed data saved to /Users/sikao/Documents/GitHub/ionerdss/data/8erq_dir/nerdss_output/figure_plot_data/fraction_of_monomers_assembled_vs_time.csv
Plot saved to /Users/sikao/Documents/GitHub/ionerdss/data/8erq_dir/nerdss_output/figure_plot_data/fraction_of_monomers_assembled_vs_time.svg
[8]:
analysis_8erq.plot_figure(figure_type='hist', x='size', y='complex_count', legend=['B'], bins=10, frequency=False, normalize=False)
No simulations specified. Using all available simulations.
Plotting hist with:
- x-axis: size
- y-axis: complex_count
- z-axis: None
- Simulations: 3 selected
- Legend: ['B']
- Display mode: both
Bin edges: [ 0.   3.1  6.2  9.3 12.4 15.5 18.6 21.7 24.8 27.9 31. ]
Bin centers: [ 1.55  4.65  7.75 10.85 13.95 17.05 20.15 23.25 26.35 29.45]
Processed data saved to /Users/sikao/Documents/GitHub/ionerdss/data/8erq_dir/nerdss_output/figure_plot_data/hist_average_number_vs_size.csv
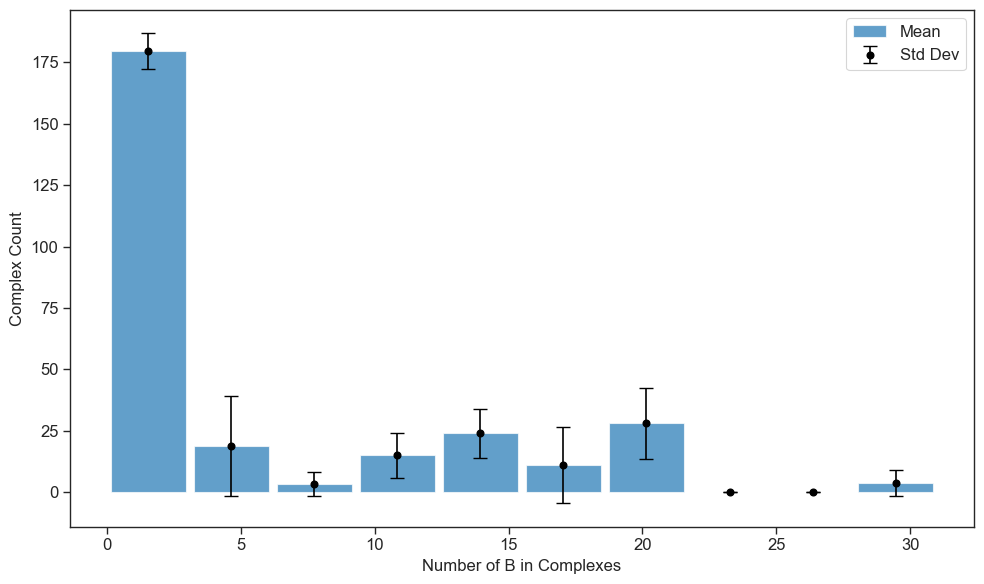
Plot saved to /Users/sikao/Documents/GitHub/ionerdss/data/8erq_dir/nerdss_output/figure_plot_data/hist_average_number_vs_size.svg
[17]:
analysis_8erq.plot_figure(figure_type='hist', x='size', y='monomer_count', legend=['B'], bins=10, frequency=True, normalize=False)
No simulations specified. Using all available simulations.
Plotting hist with:
- x-axis: size
- y-axis: monomer_count
- z-axis: None
- Simulations: 3 selected
- Legend: ['B']
- Display mode: both
Processed data saved to /Users/sikao/Documents/GitHub/ionerdss/data/8erq_dir/nerdss_output/figure_plot_data/hist_monomer_count_vs_size.csv
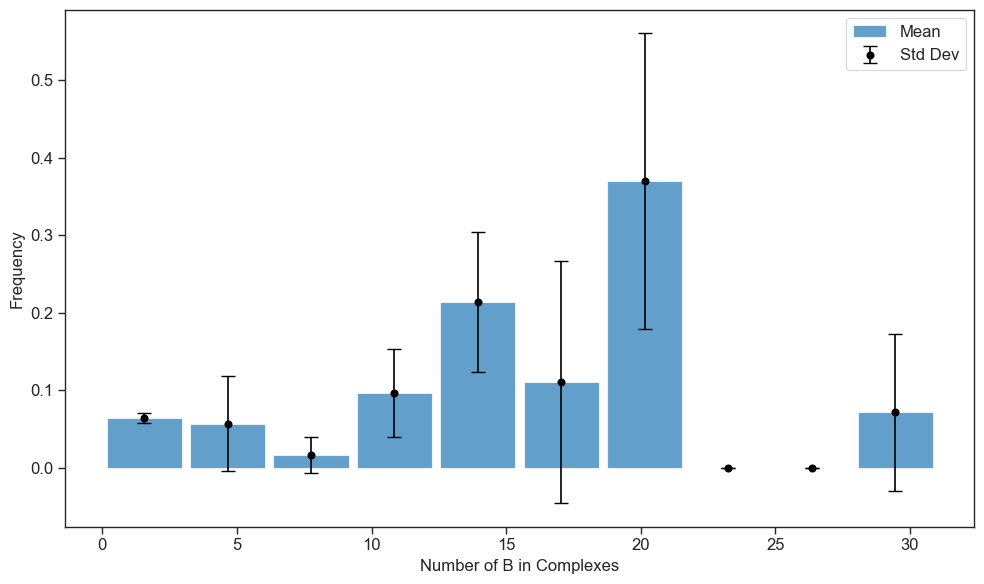
Plot saved to /Users/sikao/Documents/GitHub/ionerdss/data/8erq_dir/nerdss_output/figure_plot_data/hist_monomer_count_vs_size.svg
[9]:
analysis_8erq.plot_figure(figure_type='3dhist', x='size', y='time', z='complex_count', legend=['B'], bins=10, time_bins=5, frequency=False, normalize=False, figure_size=(12, 12))
No simulations specified. Using all available simulations.
Plotting 3dhist with:
- x-axis: size
- y-axis: time
- z-axis: complex_count
- Simulations: 3 selected
- Legend: ['B']
- Display mode: both
Time edges: [0.     0.0016 0.0032 0.0048 0.0064 0.008 ]
Time centers: [0.0008 0.0024 0.004  0.0056 0.0072]
Size edges: [ 0.   3.1  6.2  9.3 12.4 15.5 18.6 21.7 24.8 27.9 31. ]
Size centers: [ 1.55  4.65  7.75 10.85 13.95 17.05 20.15 23.25 26.35 29.45]
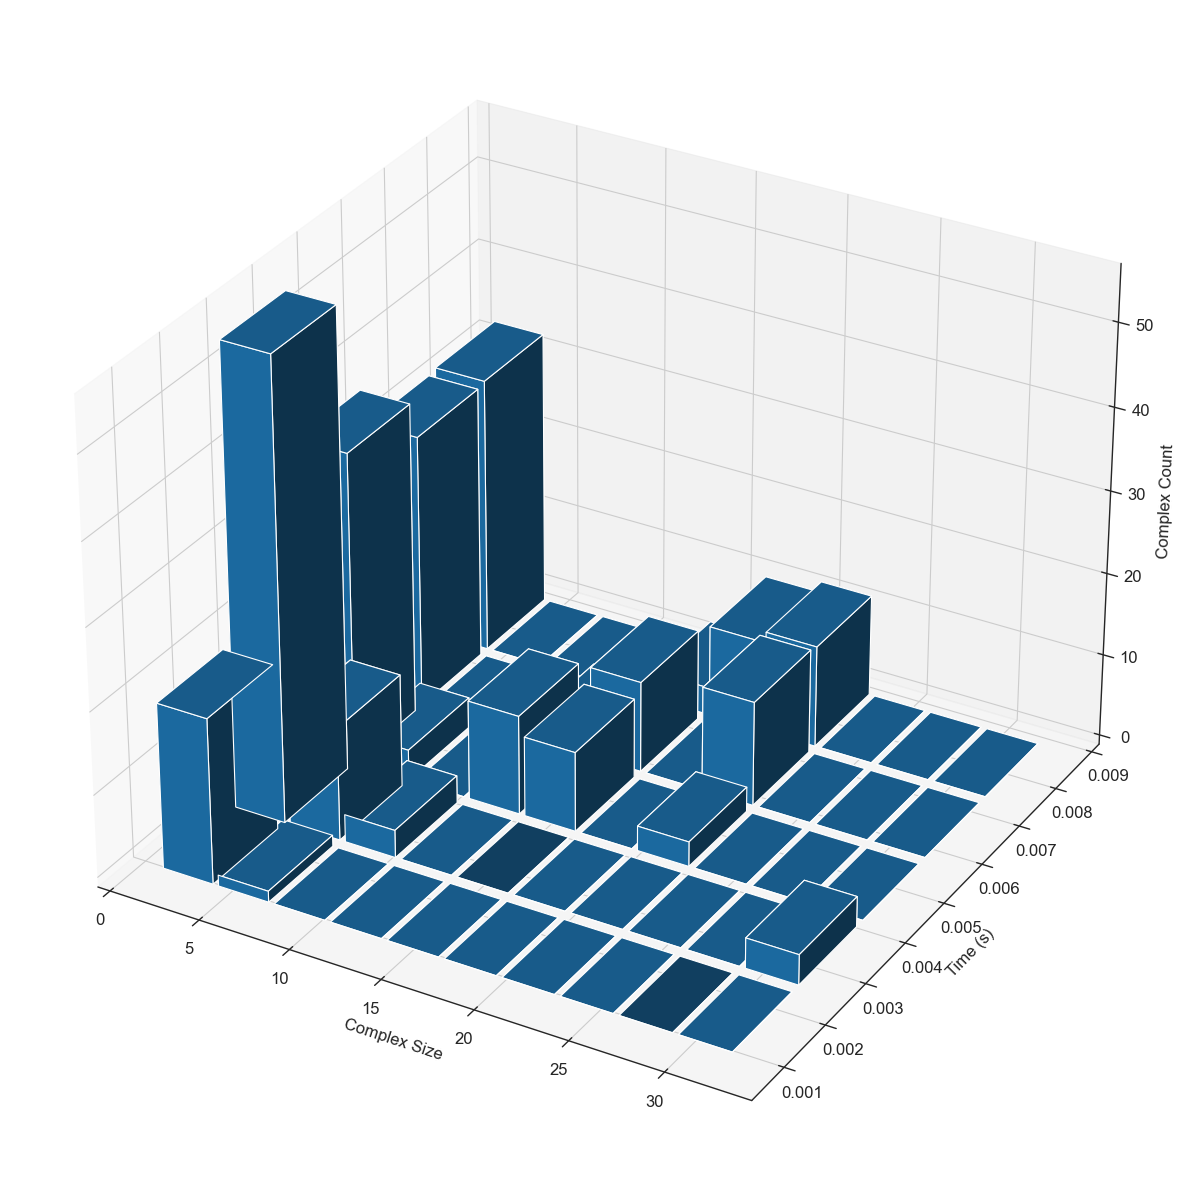
3D plot saved to /Users/sikao/Documents/GitHub/ionerdss/data/8erq_dir/nerdss_output/figure_plot_data/3D_hist_complex_species.svg
Histogram data saved to /Users/sikao/Documents/GitHub/ionerdss/data/8erq_dir/nerdss_output/figure_plot_data/hist_complex_species_size_3d.csv
[10]:
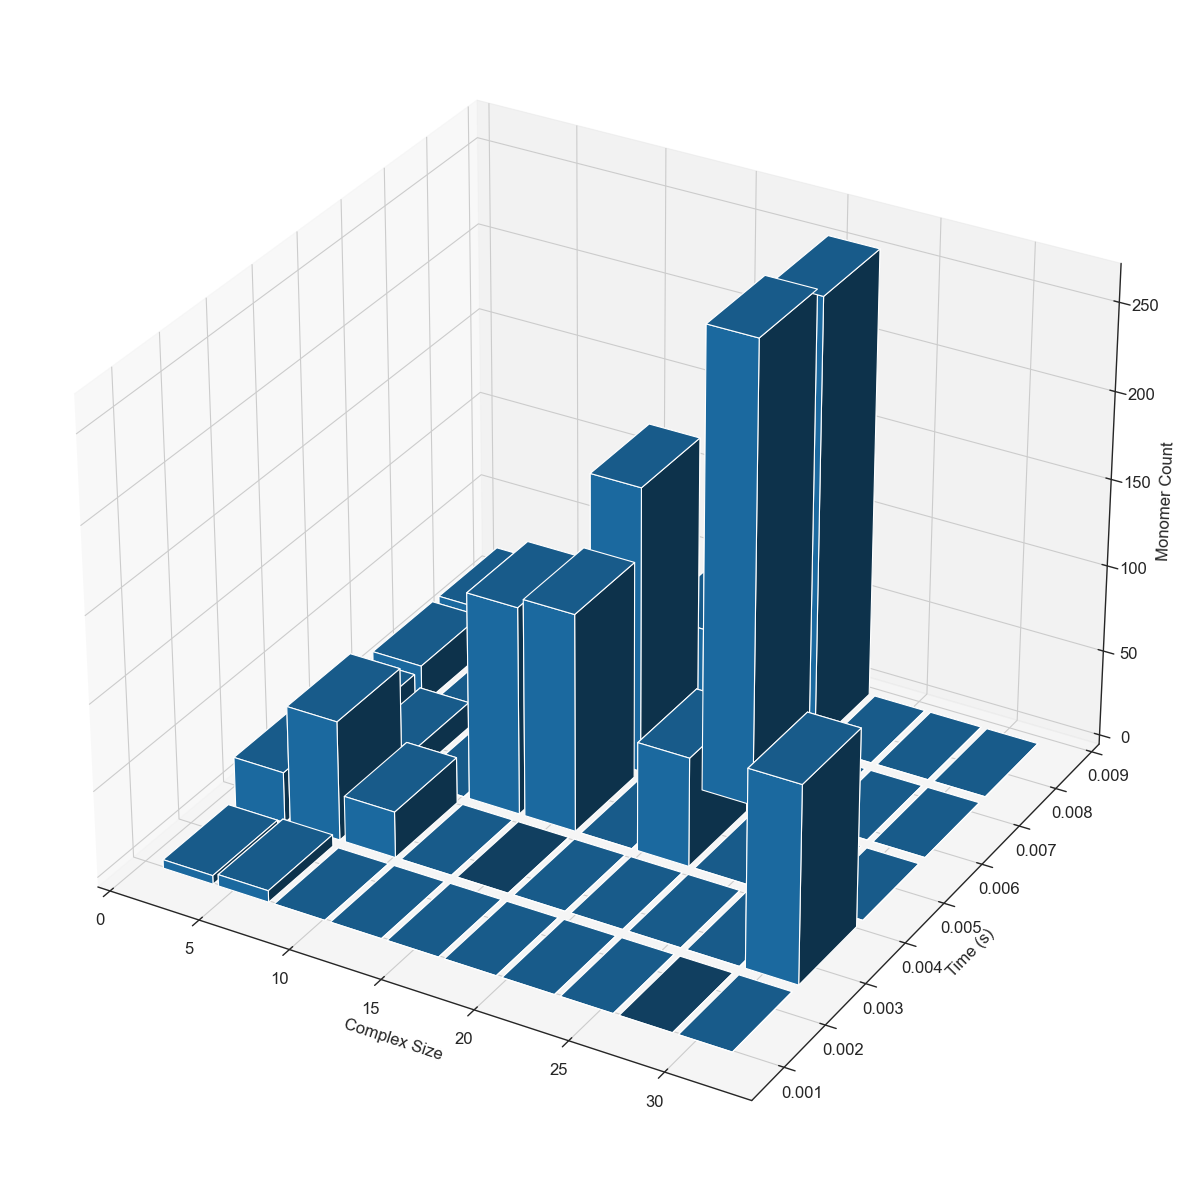
analysis_8erq.plot_figure(figure_type='3dhist', x='size', y='time', z='monomer_count', legend=['B'], bins=10, time_bins=5, frequency=False, normalize=False, figure_size=(12, 12))
No simulations specified. Using all available simulations.
Plotting 3dhist with:
- x-axis: size
- y-axis: time
- z-axis: monomer_count
- Simulations: 3 selected
- Legend: ['B']
- Display mode: both
Time edges: [0.     0.0016 0.0032 0.0048 0.0064 0.008 ]
Time centers: [0.0008 0.0024 0.004  0.0056 0.0072]
Size edges: [ 0.   3.1  6.2  9.3 12.4 15.5 18.6 21.7 24.8 27.9 31. ]
Size centers: [ 1.55  4.65  7.75 10.85 13.95 17.05 20.15 23.25 26.35 29.45]
3D plot saved to /Users/sikao/Documents/GitHub/ionerdss/data/8erq_dir/nerdss_output/figure_plot_data/3D_hist_monomer_species.svg
Histogram data saved to /Users/sikao/Documents/GitHub/ionerdss/data/8erq_dir/nerdss_output/figure_plot_data/hist_monomer_count_vs_size_3d.csv
[4]:
analysis_8erq.plot_figure(figure_type='heatmap', x='size', y='size', z='complex_count', legend=['A', 'B'], bins=10, frequency=False, normalize=False, figure_size=(8, 6))
No simulations specified. Using all available simulations.
Plotting heatmap with:
- x-axis: size
- y-axis: size
- z-axis: complex_count
- Simulations: 3 selected
- Legend: ['A', 'B']
- Display mode: both
X edges: [ 0.   1.5  3.   4.5  6.   7.5  9.  10.5 12.  13.5 15. ]
Y edges: [ 0.   3.1  6.2  9.3 12.4 15.5 18.6 21.7 24.8 27.9 31. ]
Heatmap data saved to /Users/sikao/Documents/GitHub/ionerdss/data/8erq_dir/nerdss_output/figure_plot_data/heatmap_species_a_vs_b.csv
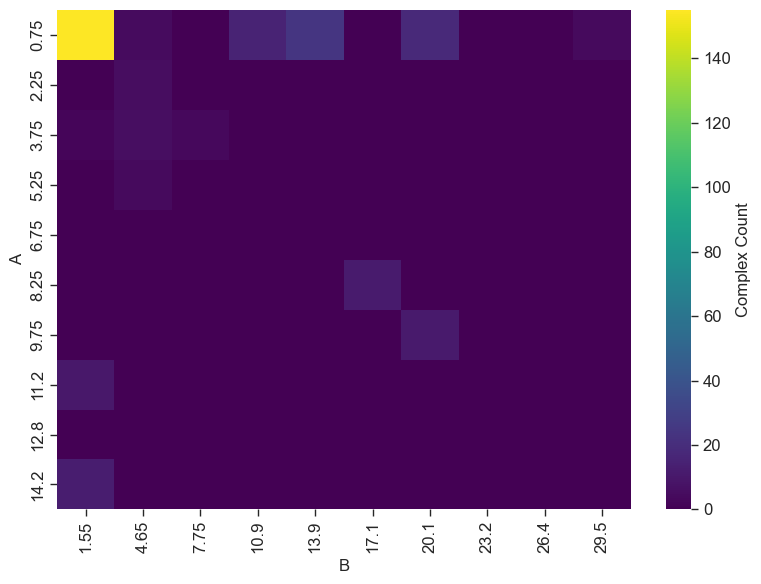
Heatmap plot saved to /Users/sikao/Documents/GitHub/ionerdss/data/8erq_dir/nerdss_output/figure_plot_data/heatmap_species_a_vs_b.svg
[3]:
analysis_8erq.plot_figure(figure_type='stacked', x='size', y='complex_count', legend=["B: A<2, A=2, A>2"], bins=10, frequency=False, normalize=False, figure_size=(8, 6))
No simulations specified. Using all available simulations.
Plotting stacked with:
- x-axis: size
- y-axis: complex_count
- z-axis: None
- Simulations: 3 selected
- Legend: ['B: A<2, A=2, A>2']
- Display mode: both
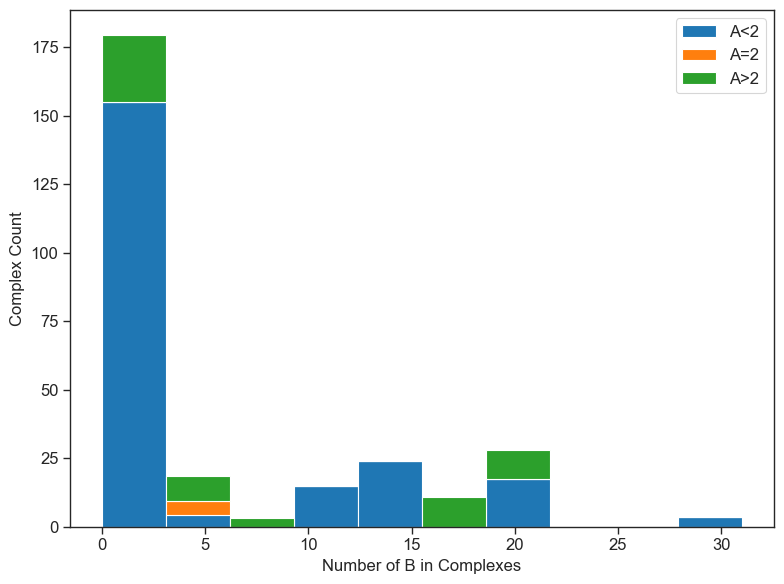
Stacked histogram saved to /Users/sikao/Documents/GitHub/ionerdss/data/8erq_dir/nerdss_output/figure_plot_data/stacked_hist_complex_species_size.svg
Stacked histogram data saved to /Users/sikao/Documents/GitHub/ionerdss/data/8erq_dir/nerdss_output/figure_plot_data/stacked_hist_complex_species_size.csv